Close Menu
FintechFetch
    FintechFetch
    • Home
    • Fintech
    • Financial Technology
    • Credit Cards
    • Finance
    • Stock Market
    • More
      • Business Startups
      • Blockchain
      • Bitcoin News
      • Cryptocurrency
    FintechFetch
    Home»Blockchain»Stellar Setting Up For Rally To $1.60 – Here Are The Key Levels
    Blockchain

    Stellar Setting Up For Rally To $1.60 – Here Are The Key Levels

    FintechFetchBy FintechFetchMarch 6, 2025No Comments3 Mins Read
    Share Facebook Twitter Pinterest LinkedIn Tumblr Reddit Telegram Email
    Share
    Facebook Twitter LinkedIn Pinterest Email


    Este artículo también está disponible en español.

    Stellar (XLM) is attempting to reclaim a recently lost level that could propel the price to a retest of a key resistance zone. Some market watchers suggested that its price could be preparing for a massive surge to a new all-time high (ATH).

    Related Reading

    Stellar Getting Ready For 300% Breakout

    Stellar has seen a 9% surge in the past day, recovering from this week’s market dump and rallying to the $0.30 mark again. According to crypto analyst Ali Martinez, Stellar could witness a 300% breakout soon as the cryptocurrency appears to be forming a bullish pattern.

    After the November 2024 breakout, XLM started to form a bullish flag, with the 600% post-US election rally forming the pattern’s flagpole. Since then, Stellar has been consolidating between the $0.63 and $0.25 price range, forming the pattern’s flag.

    XLM’s chart appears to be forming a bull flag. Source: Ali Martinez on X

    Since hitting its 3-year high in December, XLM has seen a 52% price decrease, failing to break above its downtrend line. During the February market retraces, the cryptocurrency retraced nearly 40% from its monthly opening, hitting its lowest price action since November.

    Over the weekend, Stellar followed the rest of the crypto market, fueled by US President Donald Trump’s announcement of a US Crypto Strategic Reserve comprised of “made in the USA” cryptocurrencies like XRP, Cardano (ADA), and Solana (SOL).

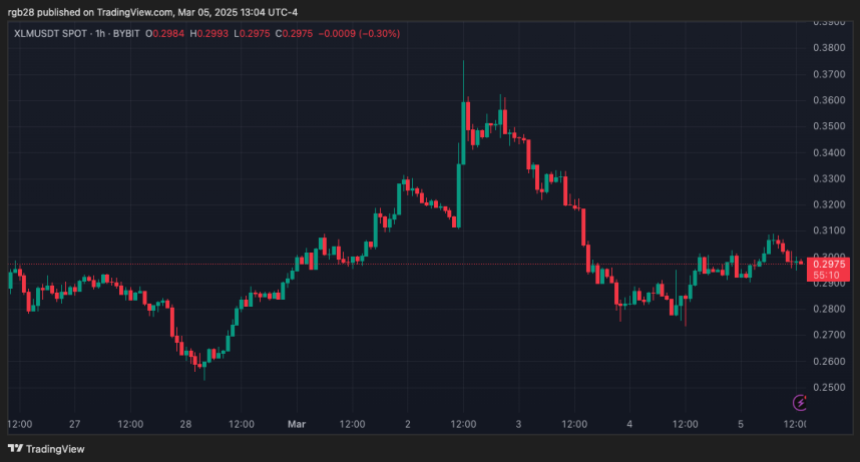
    XLM surged around 25% from the range’s lower levels to $0.37, retesting the $0.35 key resistance. The $0.32-$0-35 range has been a key zone for the cryptocurrency since the Q4 2024 breakout, serving as a crucial support level until turning into resistance in February.

    As the analyst pointed out, “A sustained break above the $0.42 resistance could trigger a bull run to $1.60.” Nonetheless, the cryptocurrency’s recent performance has failed to reclaim a key level in the mid-zone of its 3-month price range.

    XLM Following 2017’s Playbook?

    XLM failed to hold the $0.35 level amid the Monday market dump, retracing 20% and erasing the Sunday gains. Breaking above this resistance could send Stellar’s price to the bull flag’s upper range while failing to reclaim it could send the price to the pattern’s lower range between $0.20 and $0.23.

    On Tuesday, the cryptocurrency continued bleeding and retested its recent lows as support. XLM bounced from $0.27 above the $0.30 level on Wednesday morning, attempting to reclaim it.

    Technical Analyst Charting Guy highlighted that XLM’s Relative Strength Index (RSI) recently broke out of a 96-day downtrend “while price consolidated in the golden pocket with time capitulation getting to people.”

    Related Reading

    He also noted that XLM’s bull flag “coincidentally targets” the 1.272 Fibonacci level at around $2.46. After its recent performance, the cryptocurrency appears to be following its 2017 pattern, which adds “more confluence to 1.272 fib target,” he explained.

    In Q4 2017, Stellar saw a similar price breakout, followed by a consolidation period within a bullish flag. XLM then broke out of this pattern and rose over 190% to ATH in early 2018. To the analyst, “Once we break above the top of the golden pocket, it’s game on.”

    At the time of writing, Stellar trades at $0.30, a 2.4% increase in the weekly timeframe.

    Stellar, XLM, XLMUSDT
    XLM’s performance in the one-week chart. Source: XLMUSDT on TradingView

    Featured Image from Unsplash.com, Chart from TradingView.com


    Source link

    Share. Facebook Twitter Pinterest LinkedIn Tumblr Email
    Previous ArticleEmirates NBD’s Liv Unveils New Crypto Offering for UAE Customers in Mobile Banking App
    Next Article £10,000 invested in Scottish Mortgage shares 1 month ago is now worth…
    FintechFetch
    • Website

    Related Posts

    Blockchain

    Bitcoin’s Creator Just Took a $20B Hit — If He’s Still Watching

    October 19, 2025
    Blockchain

    Here Are Seven Vital On-Chain Signals Spotted From Recent Crash

    October 19, 2025
    Blockchain

    Bitcoin Slips Below STH Cost Basis – Why This Could Be A Buy Signal?

    October 19, 2025
    Add A Comment
    Leave A Reply Cancel Reply

    Top Posts

    Kevin O’Leary: Most Overlooked Startup Opportunity Right Now

    April 4, 2025

    Will BNB Overtake XRP – and When? AI Reveals Shocking Answer

    October 4, 2025

    What Is a Crypto Airdrop? A Beginner’s Guide to Free Crypto

    August 1, 2025

    Revolut Aims for 10 Million Users in France with EU HQ and Banking License Push

    May 25, 2025

    Welcoming Siargao Into the Digital Era: Bitget Launches Starlink Programme in the Filipino Island

    May 15, 2025
    Categories
    • Bitcoin News
    • Blockchain
    • Business Startups
    • Credit Cards
    • Cryptocurrency
    • Finance
    • Financial Technology
    • Fintech
    • Stock Market
    Most Popular

    £20k in an ISA? Here’s how it could generate £1 of passive income every hour — forever

    February 9, 2025

    Klaus Schaub: What’s Next For Newly Fired WEF Chairman?

    April 24, 2025

    Choco Up, Wonder Capital Launch US$50M Private Credit Fund for APAC SMEs

    March 11, 2025
    Our Picks

    Africa Crypto News Week in Review: ABSA and Ripple Join Hands, Central Bank of Ghana Crypto Regulations; Blockchain.com Seeks License in Nigeria

    October 19, 2025

    How Is the Options Market Reacting to Bitcoin’s Continued Decline? (Glassnode)

    October 19, 2025

    By 2026, this 52p penny stock could turn £10,000 into…

    October 19, 2025
    Categories
    • Bitcoin News
    • Blockchain
    • Business Startups
    • Credit Cards
    • Cryptocurrency
    • Finance
    • Financial Technology
    • Fintech
    • Stock Market
    • Privacy Policy
    • Disclaimer
    • Terms and Conditions
    • About us
    • Contact us
    Copyright © 2024 Fintechfetch.comAll Rights Reserved.

    Type above and press Enter to search. Press Esc to cancel.