
Reason to trust
Strict editorial policy that focuses on accuracy, relevance, and impartiality
Created by industry experts and meticulously reviewed
The highest standards in reporting and publishing
Strict editorial policy that focuses on accuracy, relevance, and impartiality
Morbi pretium leo et nisl aliquam mollis. Quisque arcu lorem, ultricies quis pellentesque nec, ullamcorper eu odio.
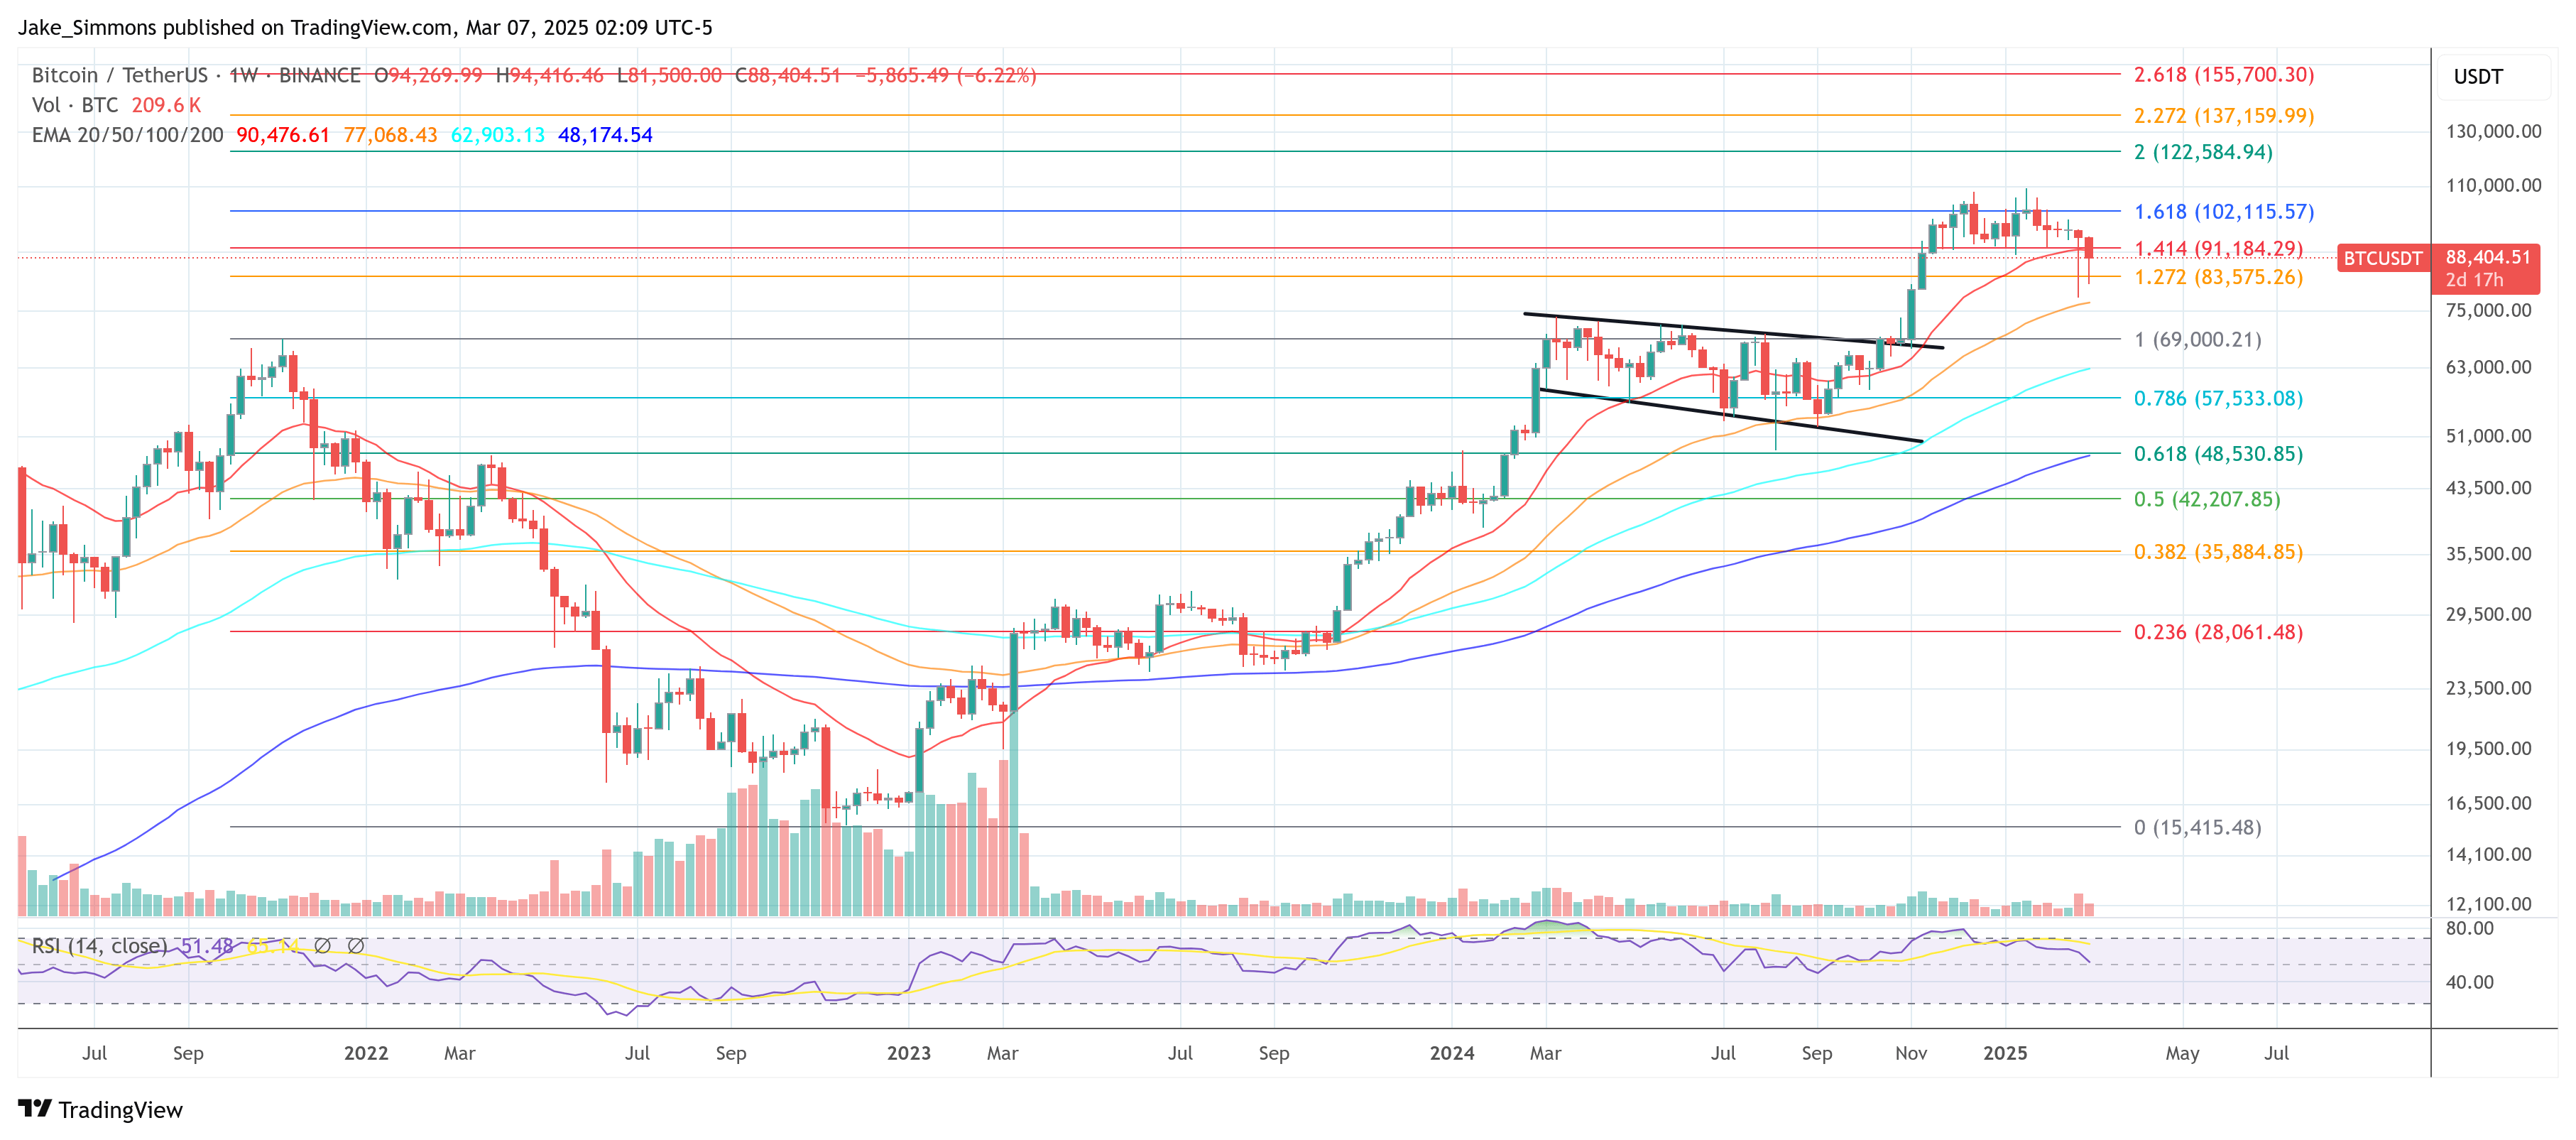
This week, the US Dollar Index (DXY) has recorded one of its largest three-day negative performances in recent history. Since Monday, the DXY is down -5.4%, falling from 109.881 to 103.967—an event some market observers interpret as a bullish inflection point for Bitcoin. Jamie Coutts, Chief Crypto Analyst at Real Vision, has drawn on historical comparisons to argue that the steep DXY decline could portend a significant upswing in the world’s largest cryptocurrency by market capitalization.
DXY’s Historic Drop Signals A Major Bitcoin Rally
Coutts presented the findings of two historical backtests on X, detailing how similar DXY drops have coincided with pivotal moments in Bitcoin’s price cycles. He wrote: “When looking at this recent move in the DXY through a historical lens, it’s challenging to be anything but bullish. I ran a signal screen for 3-day negative moves of more than -2% & -2.5% and found they have all occurred at Bitcoin bear market troughs (inflection points) or mid-cycle bull markets (trend continuations).” Although the statistical significance is limited by Bitcoin’s relatively short trading history, Coutts underscored that these data points are nonetheless worth considering.
Related Reading
In his first backtest covering DXY declines of more than -2.5%, Coutts found such a scenario on eight occasions since 2013. Over a 90-day period following those declines, Bitcoin rose every single time, giving it a perfect 100% win rate. The average return was +37%, which would translate to an estimated BTC price of around $123,000, while a move of one standard deviation above that average reached +63% (approximately $146,000 BTC). Even in the worst instance, Bitcoin still managed to gain 14%, putting it around $102,000 BTC.
In his second backtest focusing on DXY declines of more than -2.0%, there were 18 such occurrences since 2013, and Bitcoin was up 17 out of those 18 times for a 94% win rate. The average 90-day return stood at +31.6%, close to $118,000 BTC, while a one standard deviation move was +57.8% (around $141,000 BTC). The worst 90-day return after such a DXY drop was -14.6% (approximately $76,500 BTC).
Related Reading
Acknowledging that these backtests cannot offer guarantees, Coutts stated, “I made a bold call yesterday about new highs by May. I try to base projections on robust data points. Ofc this time might be different. Let’s see.”
Analysts often view a declining DXY as a sign of improving risk appetite in global markets, which can favor alternative stores of value and risk assets, including Bitcoin and other cryptocurrencies. The US Dollar Index’s abrupt retreat comes on the heels of regulatory concerns and a challenging February for Bitcoin, yet Coutts maintains that the larger trend looks remarkably similar to historical points of resurgence.
He also noted in a post from the previous day: “Don’t think people understand the significance of the DXY move in the past 3 days and what it means for Bitcoin. […] The DXY saw its 4th largest negative 3-day move—massively liquidity-positive. Just as Bitcoin nuked and had its worst Feb in a decade. Meanwhile, in altcoin land, the Top 200 crypto index puked one more time. The chart shows that 365 days of New Lows hit 47%, a hallmark of capitulation in a bull cycle. The stage is set for a new all-time high in Bitcoin and Top 200 aggregate market cap by May.”
At press time, BTC traded at $88,404.
Featured image created with DALL.E, chart from TradingView.com