

Bitcoin may be approaching one of the most interesting technical windows of its current market cycle. A newly shared historical chart suggests that BTC has repeatedly broken major descending resistance lines around 1,000 days after a halving, raising questions about whether another recovery could be approaching.
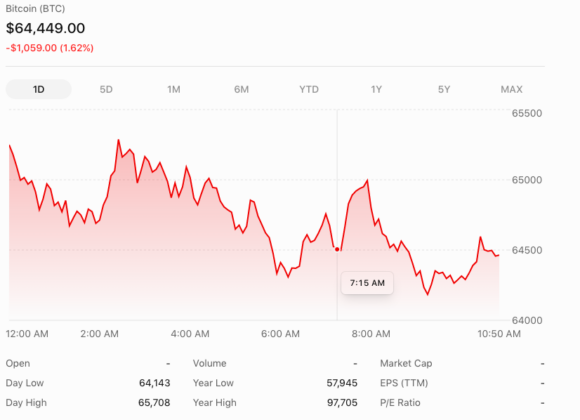
The analysis comes as Bitcoin trades near $64,282.54, according to the latest price provided at the time of writing, following a significant correction from its 2025 highs.
While traders continue debating whether the four-year cycle remains relevant, Bitcoinist recently examined how Bitcoin’s technical structure could avoid new lows, highlighting the importance of reclaiming long-term moving averages.
Now, another historical pattern is attracting attention.
Bitcoin’s 1,000-Day Pattern Returns
On November 16, Rand Group shared a chart credited to analyst Jesse Olson, highlighting an unusual similarity between previous Bitcoin halving cycles.

The analysis suggests that Bitcoin’s 2016 and 2020 cycles broke their post-peak descending trendlines around day 1,000 after their respective halvings.
The chart overlays several cycles, using the number of days after each halving to compare their price structures.
According to Rand Group, the current cycle is approaching the same historical window.
Using the April 20, 2024 halving date, November 16, 2026 represents approximately day 940, leaving around 60 days before the 1,000-day milestone.
The historical comparison is particularly interesting because both previous breakouts occurred after extended periods of declining prices.
However, the pattern does not establish that Bitcoin must repeat its earlier performance.
The Bitcoin halving history confirms the dates used to compare the cycles, but the descending trendlines and their breakout timing remain the analyst’s interpretation.
Bitcoin Price Technical Analysis: Can BTC Break Its Downtrend?
The central question is whether Bitcoin’s current price structure supports the possibility of another trend reversal.
At approximately $64,282, Bitcoin remains below the immediate $65,000 resistance area.
A sustained recovery above that threshold could provide the first indication of improving short-term momentum.
However, stronger confirmation would require BTC to reclaim higher resistance around $68,000 and $70,000.
From a technical perspective, a descending trendline connects a series of lower highs.
Breaking above that line suggests selling pressure may be weakening, but traders generally look for additional confirmation through stronger volume and successful retests.
The Relative Strength Index is another important indicator.
A sustained move above 50 could suggest improving bullish momentum, particularly if Bitcoin simultaneously establishes higher lows.
Conversely, continued rejection below resistance would indicate that the broader downtrend remains intact.
The $62,000 region represents an important downside reference, followed by the psychological $60,000 level.
Could Bitcoin Repeat Its Previous Halving Cycles?
Historical cycle analysis has become increasingly popular as investors search for signs of a market bottom.
Bitcoinist previously covered an analyst’s Bitcoin cycle timing model, which similarly examined recurring intervals between major market turning points.
Nevertheless, exact timing models can be misleading when they rely on a small number of historical observations.
Bitcoin’s current market structure is also different from earlier cycles.
Institutional participation, exchange-traded funds, and changing global liquidity conditions could influence how future recoveries develop.
Another Bitcoinist analysis explored the possibility of a historical Bitcoin fakeout, demonstrating why investors should consider alternative scenarios before treating recurring chart formations as guaranteed outcomes.
The strongest bullish signal would not simply be reaching day 1,000.
Instead, it would be a confirmed breakout above descending resistance, supported by improving volume, momentum, and market structure.
What’s Next For Bitcoin?
Bitcoin’s approaching 1,000-day milestone offers an intriguing historical comparison.
If the pattern highlighted by Rand Group repeats, the coming weeks could become an important period for traders watching the end of the current downtrend.
We believe the technical evidence deserves attention, particularly if Bitcoin begins reclaiming resistance levels and establishing a sequence of higher lows.
However, historical similarities alone cannot confirm a market bottom.
For now, $65,000 remains the first resistance area to monitor, followed by $68,000 and $70,000.
A convincing breakout through these levels could strengthen the case for a broader recovery.
Until then, the 1,000-day halving pattern remains a potentially bullish setup awaiting confirmation.