Close Menu
FintechFetch
    FintechFetch
    • Home
    • Fintech
    • Financial Technology
    • Credit Cards
    • Finance
    • Stock Market
    • More
      • Business Startups
      • Blockchain
      • Bitcoin News
      • Cryptocurrency
    FintechFetch
    Home»Blockchain»Here’s Where Support & Resistance Lies For Solana, Based On On-Chain Data
    Blockchain

    Here’s Where Support & Resistance Lies For Solana, Based On On-Chain Data

    FintechFetchBy FintechFetchMarch 20, 2025No Comments4 Mins Read
    Share Facebook Twitter Pinterest LinkedIn Tumblr Reddit Telegram Email
    Share
    Facebook Twitter LinkedIn Pinterest Email


    Reason to trust

    Strict editorial policy that focuses on accuracy, relevance, and impartiality

    Created by industry experts and meticulously reviewed

    The highest standards in reporting and publishing

    Strict editorial policy that focuses on accuracy, relevance, and impartiality

    Morbi pretium leo et nisl aliquam mollis. Quisque arcu lorem, ultricies quis pellentesque nec, ullamcorper eu odio.


    Este artículo también está disponible en español.

    The analytics firm Glassnode has revealed the Solana price levels that could be important to watch, based on on-chain accumulation data.

    Solana Cost Basis Distribution Reveals Where Supply Is Most Concentrated

    In a new post on X, Glassnode has discussed about the UTXO Realized Price Distribution (URPD) of Solana. The URPD is an indicator that basically tells us about how much of the SOL supply was purchased at which price levels. Naturally, the metric uses the last transaction price of any token in circulation as its cost basis.

    Related Reading

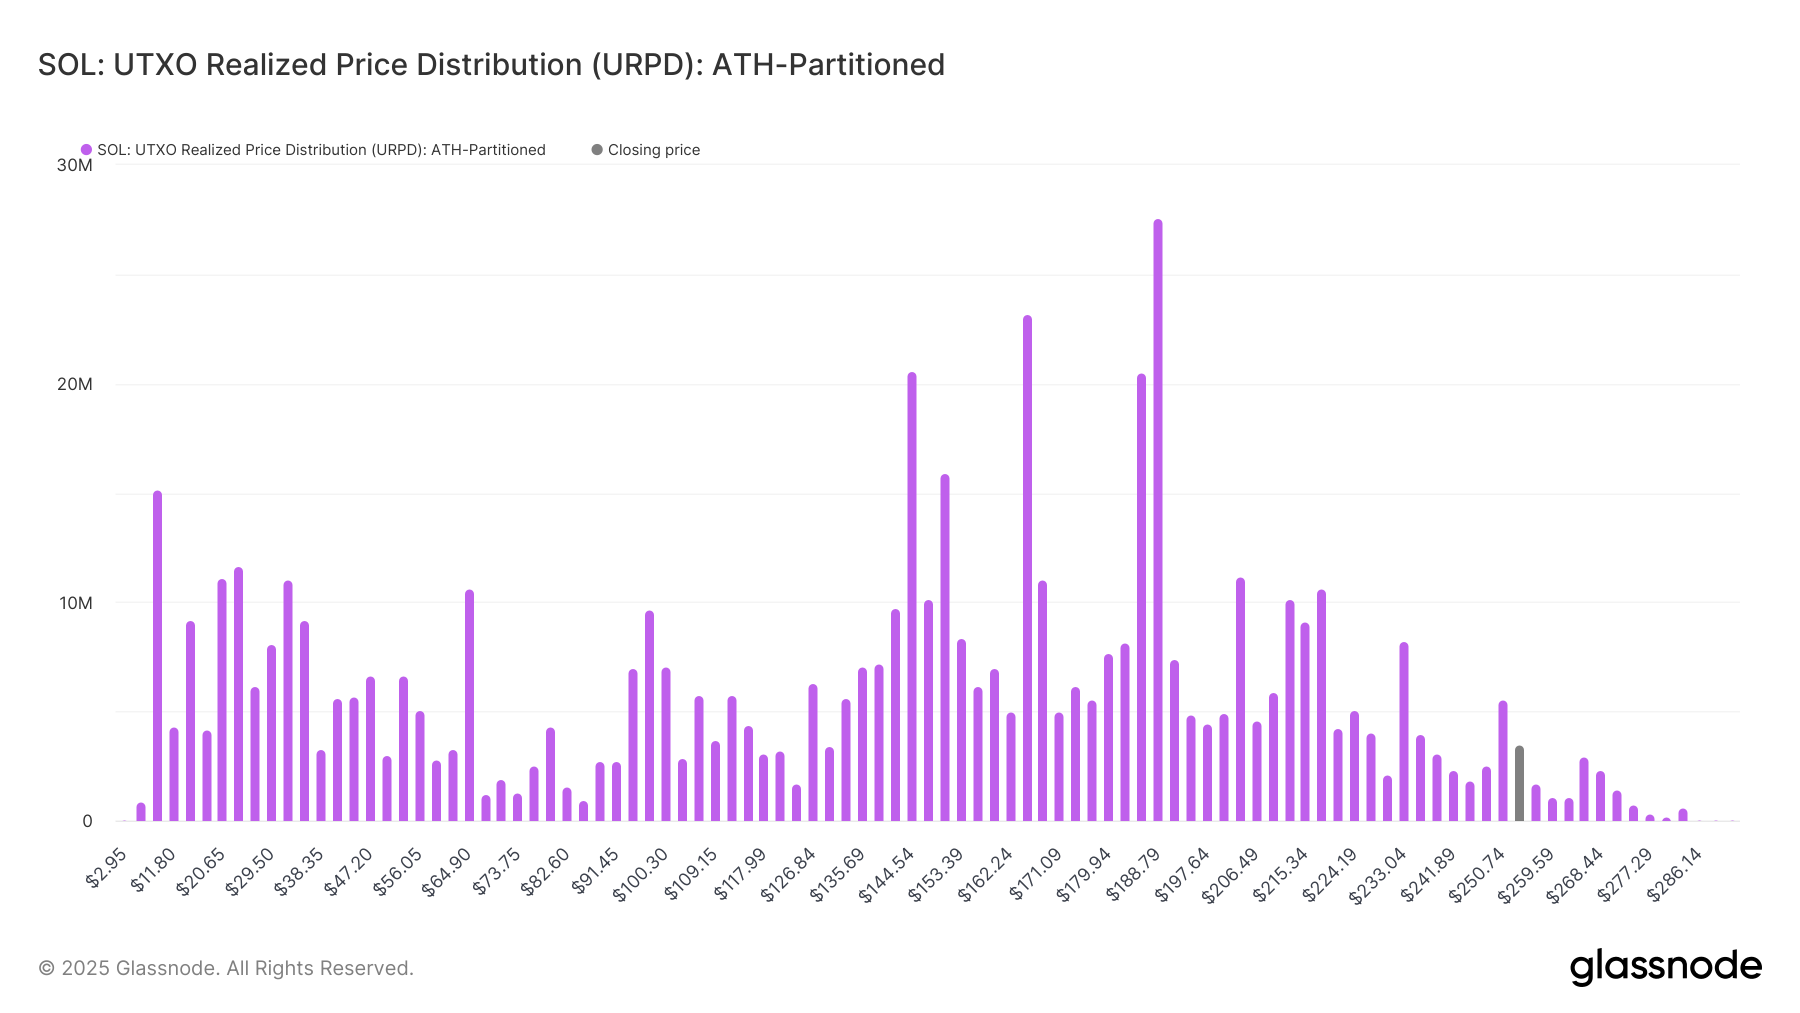
    First, here is how the URPD looked when the cryptocurrency set its new all-time high (ATH) back in January:
    Solana URPD
    The cost basis distribution of the asset as it stood on 19th of January | Source: Glassnode on X

    From the graph, it’s apparent that a few price levels like $144 stood out in terms of the amount of supply that they hosted. At the price levels closer to the new ATH, however, supply was quite thin, meaning not many coins changed hands there.

    In on-chain analysis, the potential of any level to act as support or resistance is measured in terms of the amount of supply that it hosts. This means that levels that have a large cluster around them on the URPD are the ones of importance to the asset.

    As for why this is so, the answer lies in investor psychology: holders are sensitive to retests of their cost basis. Whenever the price touches a large cost basis cluster, the investors who are holding these coins may respond by making some panic moves.

    These moves can tend toward buying if the retest is happening from above, as investors may want to defend their profit-loss boundary. In retests happening from below, however, the traders could react by selling instead, as they may seek to exit at their break-even.

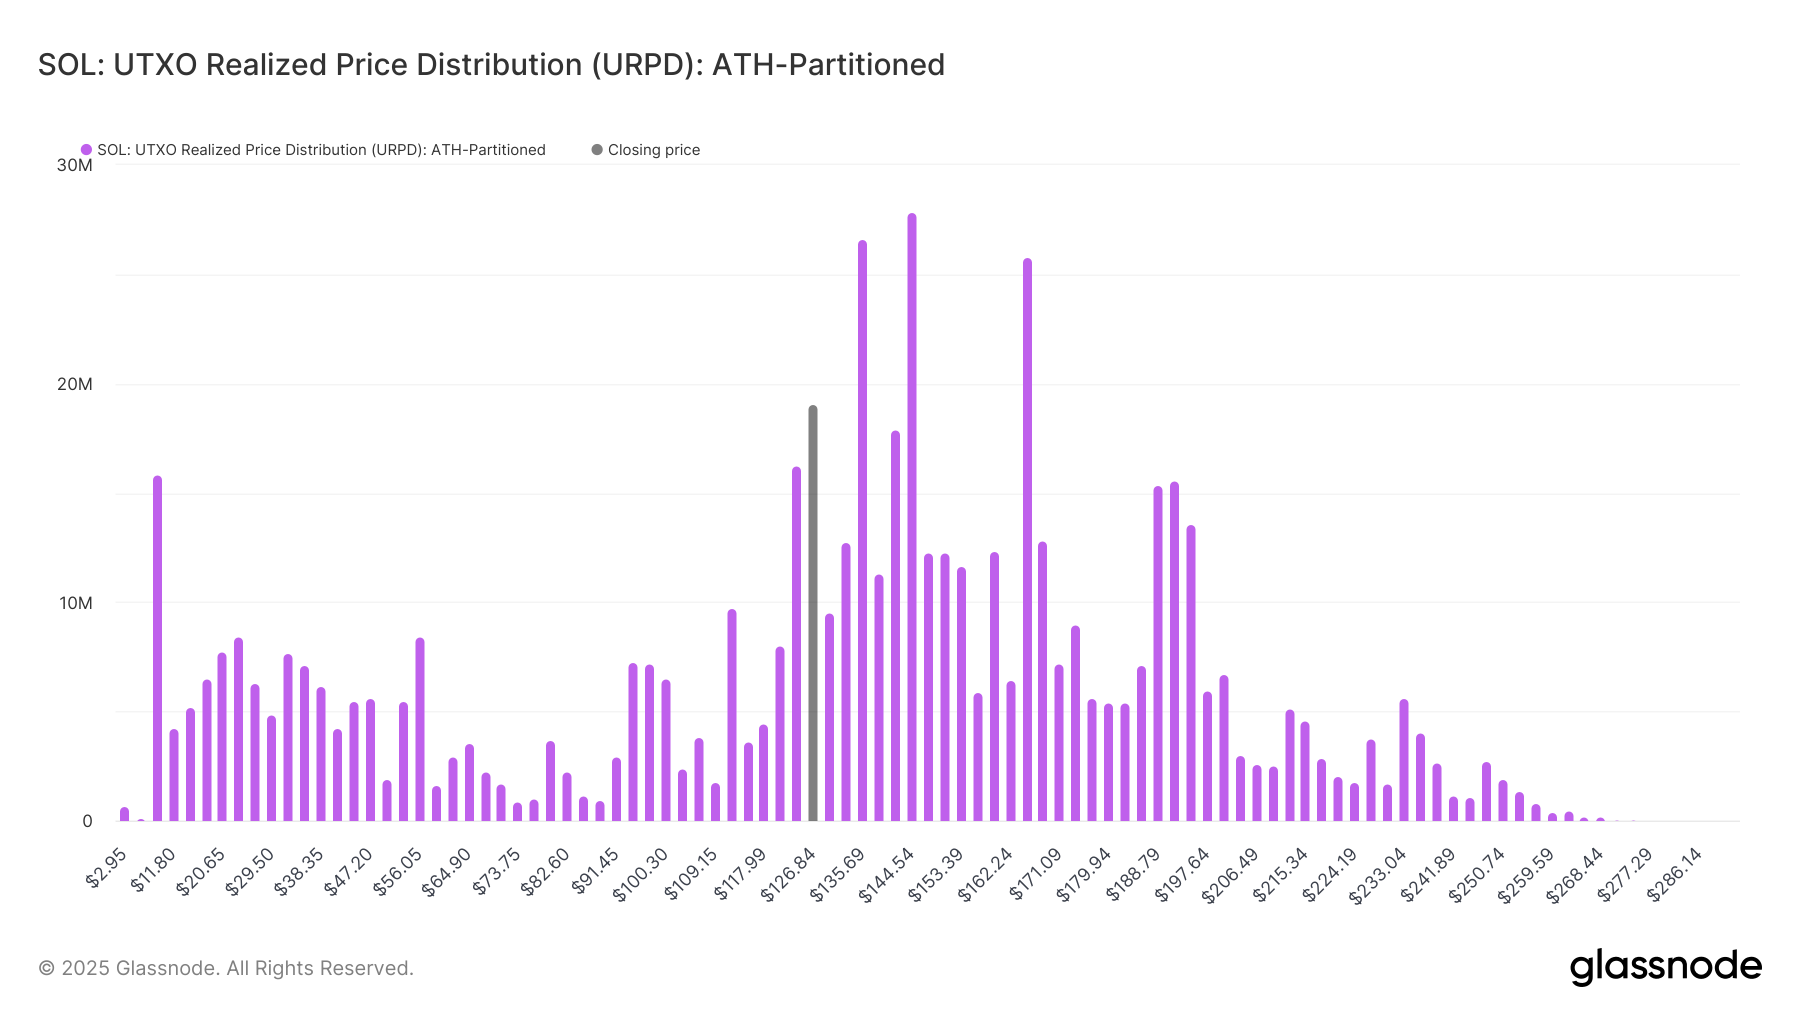
    When SOL reached its ATH, there was a lack of support nearby. This may be why the asset ended up falling into the cluster that did carry a significant amount of supply. Below is a chart that shows how the URPD has changed following the price drawdown.
    Solana URPD
    The latest URPD of SOL | Source: Glassnode on X

    From the graph, it’s visible that if SOL continues its downtrend, it may have to end up relying on the freshly grown $112 level. In January, this level hosted the cost basis of 4 million tokens, but today, the figure has grown to 9.7 million, equivalent to 1.67% of the entire supply.

    Beyond this level, Glassnode notes, “$94, $97, and $100 collectively hold nearly 21M SOL (3.5% of supply).” In the scenario that these support levels fail, Solana may find itself in trouble, as there aren’t any major supply clusters until $53.

    Related Reading

    In terms of the levels above, the $135 and $144 levels stand out, as they hold the acquisition level of 26.6 million and 27 million coins, respectively. These levels could act as major obstacles in SOL’s recovery.

    SOL Price

    Solana has jumped more than 5% over the last 24 hours to recover to the $130 level.

    Solana Price Chart
    The trend in the price of the coin over the last five days | Source: SOLUSDT on TradingView

    Featured image from Shutterstock.com, Glassnode.com, chart from TradingView.com


    Source link

    Share. Facebook Twitter Pinterest LinkedIn Tumblr Email
    Previous ArticleNever heard of JOMO? It’s a cure for FOMO
    Next Article Down 20% since February despite excellent 2024 results, is IAG’s share price set to soar again?
    FintechFetch
    • Website

    Related Posts

    Blockchain

    Best Crypto to Buy as States Embrace $BTC Reserves

    June 23, 2025
    Blockchain

    $96,000 Or $144,000? Bitcoin Mayer Multiple Chart Present Price Target Options

    June 22, 2025
    Blockchain

    $312M ETH Transfer Triggers Sell-Off Fears As Ethereum Price Crashes Below Support

    June 22, 2025
    Add A Comment
    Leave A Reply Cancel Reply

    Top Posts

    Free Webinar | March 11: 3 Biggest Mistakes Entrepreneurs Make (And How to Fix Them)

    February 20, 2025

    Get the $250 Rowing Machine That’s Also Good for Business

    February 26, 2025

    Social Media Users Are More Likely to Invest in Crypto

    February 9, 2025

    Bitcoin Price Break Above $107,000 Triggers Bullishness, These Factors Will Drive A Faster Rise

    June 11, 2025

    Are February’s 3 fastest falling blue-chips the best shares to buy in March?

    February 28, 2025
    Categories
    • Bitcoin News
    • Blockchain
    • Business Startups
    • Credit Cards
    • Cryptocurrency
    • Finance
    • Financial Technology
    • Fintech
    • Stock Market
    Most Popular

    Learn How to Delegate Now — or Risk Losing Your Business

    May 4, 2025

    Stake Launches Pay to Card With Checkout.com to Democratise Access to Real Estate Investment

    June 19, 2025

    BONK Flashes Buy Signal After Crashing 40% In One Week

    February 8, 2025
    Our Picks

    Bitcoin Price Crashes Below $100K as Iran Votes to Close Straits of Hormuz

    June 23, 2025

    Nvidia stock has soared 1,471% in 5 years. Here’s how I’m hunting for the next Nvidia!

    June 23, 2025

    Best Crypto to Buy as States Embrace $BTC Reserves

    June 23, 2025
    Categories
    • Bitcoin News
    • Blockchain
    • Business Startups
    • Credit Cards
    • Cryptocurrency
    • Finance
    • Financial Technology
    • Fintech
    • Stock Market
    • Privacy Policy
    • Disclaimer
    • Terms and Conditions
    • About us
    • Contact us
    Copyright © 2024 Fintechfetch.comAll Rights Reserved.

    Type above and press Enter to search. Press Esc to cancel.