Close Menu
FintechFetch
    FintechFetch
    • Home
    • Fintech
    • Financial Technology
    • Credit Cards
    • Finance
    • Stock Market
    • More
      • Business Startups
      • Blockchain
      • Bitcoin News
      • Cryptocurrency
    FintechFetch
    Home»Blockchain»Bitcoin Recovery Fueled By Almost $19 Billion In Crypto Inflows, Data Shows
    Blockchain

    Bitcoin Recovery Fueled By Almost $19 Billion In Crypto Inflows, Data Shows

    FintechFetchBy FintechFetchMay 6, 2025No Comments3 Mins Read
    Share Facebook Twitter Pinterest LinkedIn Tumblr Reddit Telegram Email
    Share
    Facebook Twitter LinkedIn Pinterest Email


    On-chain data shows the cryptocurrency market as a whole has witnessed capital inflows of nearly $19 billion while Bitcoin and others have gone through their recovery.

    Crypto Market Has Enjoyed Net Capital Inflows Over The Past Month

    In a new post on X, analyst Ali Martinez has talked about the latest trend in the capital inflows for cryptocurrencies. In the digital asset sector, capital mainly flows in and out through three asset classes: Bitcoin, Ethereum, and the stablecoins. The altcoins usually only see a secondary rotation of capital from these coins.

    As such, the netflows related to the three of BTC, ETH and the stables can provide a sufficient-enough estimation for the situation of the entire cryptocurrency market.

    For calculating the capital inflows/outflows related to Bitcoin and Ethereum, the “Realized Cap” indicator can be used. The Realized Cap is an on-chain capitalization model that finds the total value of any asset’s supply by assuming the value of each individual token as the same as its last transaction price. This is different from the usual Market Cap, which just sums up the supply at the current spot price.

    In short, what the Realized Cap reflects is the amount of capital that the investors of the cryptocurrency as a whole have put into it. Changes related to the metric, therefore, reflect the inflow or outflow of capital.

    In the case of the stablecoins, the change in the Market Cap is enough to gauge the capital netflow. This is down to the fact that the Realized Cap is no different from the Market Cap for them, as a result of their price never varying from the fiat currency that they are pegged to.

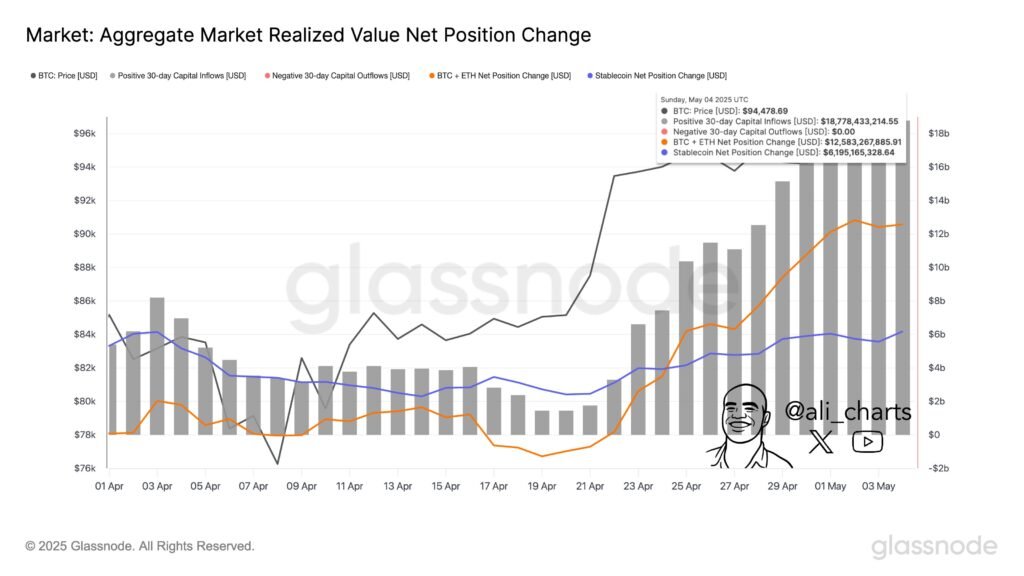
    Now, here is the chart shared by the analyst that shows the trend in the 30-day aggregate cryptocurrency market netflow based on these indicators over the past month:

    As displayed in the above graph, the combined 30-day Bitcoin and Ethereum Realized Cap change is currently at a positive $12.58 billion. This means that these two cryptocurrencies have enjoyed a notable net capital inflow during the past month.

    Similarly, the stablecoins have seen a net inflow of $6.19 billion in the same period. Thus, it seems the digital asset sector as a whole has witnessed the incoming of $18.77 billion in capital.

    While this trend has occurred, Bitcoin and the other assets have gone through their price recovery runs, so it’s possible that as long as these inflows keep up, the rallies could be sustainable.

    It only remains to be seen how the investors will behave in the coming days, however, as it often doesn’t take much for sentiment to shift in the cryptocurrency sector.

    Bitcoin Price

    At the time of writing, Bitcoin is trading around $94,200, down 1% in the last seven days.

    Bitcoin Price Chart


    Source link

    Share. Facebook Twitter Pinterest LinkedIn Tumblr Email
    Previous ArticleFrom Manual to Machine: How AI is Streamlining Compliance in Financial Services: By Erica Andersen
    Next Article The GGP share price skyrockets 100%+ in 2025 – Could this be the breakout stock of the year?
    FintechFetch
    • Website

    Related Posts

    Blockchain

    Bitcoin Crashed Below $100,000 Amid US Airstrikes On Iran And Market Sell-Off

    June 23, 2025
    Blockchain

    Best Crypto to Buy as States Embrace $BTC Reserves

    June 23, 2025
    Blockchain

    $96,000 Or $144,000? Bitcoin Mayer Multiple Chart Present Price Target Options

    June 22, 2025
    Add A Comment
    Leave A Reply Cancel Reply

    Top Posts

    1 FTSE 250 stock that analysts are calling a ‘Strong Buy’

    April 11, 2025

    XRP Price Ready For A 14% Upswing? Here’s Its Potential Path

    February 23, 2025

    Kyle Kuzma Has Won It All and Lost It All — Now He’s Taking Back His Story

    March 6, 2025

    Closing the Gender Financing Gap: Visa Foundation Launches Initiative to Support Women Led SMBs

    February 4, 2025

    BTC Price Maintains $80K After Favorable CPI Data, XRP to Get Commodity Status? (Your Weekly Recap)

    March 14, 2025
    Categories
    • Bitcoin News
    • Blockchain
    • Business Startups
    • Credit Cards
    • Cryptocurrency
    • Finance
    • Financial Technology
    • Fintech
    • Stock Market
    Most Popular

    BOOK OF MEME (BOME) Price Prediction 2025 2026 2027

    March 1, 2025

    Ondo Finance Bridges to Solana: Will the Next RWA Boom Be Driven on this Meme Coin Hub?

    May 4, 2025

    Ethereum Whales On The Move—224,000+ ETH Withdrawn In Record Outflow

    February 12, 2025
    Our Picks

    Onafriq and PAPSS Develop Access to Finance in Ghana With Cross Border Payments Service Launch

    June 23, 2025

    Thai SEC Seeks Public Feedback on Updates to Digital Asset Exchange Rules

    June 23, 2025

    5 must-use Microsoft Edge browser features to save time and money

    June 23, 2025
    Categories
    • Bitcoin News
    • Blockchain
    • Business Startups
    • Credit Cards
    • Cryptocurrency
    • Finance
    • Financial Technology
    • Fintech
    • Stock Market
    • Privacy Policy
    • Disclaimer
    • Terms and Conditions
    • About us
    • Contact us
    Copyright © 2024 Fintechfetch.comAll Rights Reserved.

    Type above and press Enter to search. Press Esc to cancel.