

Reason to trust
Strict editorial policy that focuses on accuracy, relevance, and impartiality
Created by industry experts and meticulously reviewed
The highest standards in reporting and publishing
Strict editorial policy that focuses on accuracy, relevance, and impartiality
Morbi pretium leo et nisl aliquam mollis. Quisque arcu lorem, ultricies quis pellentesque nec, ullamcorper eu odio.
After days of fluctuating around the $105,000 range, Bitcoin appears to be succumbing to pressure from bears and profit-taking from traders. The most recent 24 hours were marked by Bitcoin losing its hold on the $105,000 price level, crashing until it rebounded at a lower support range around $101,000.
However, technical analysis of Bitcoin’s daily candlestick timeframe chart shows that this price level is increasingly under threat, and a formation is currently in place that could lead to a price crash towards $96,000.
Bitcoin Head And Shoulders Pattern Forming
Crypto analyst Titan of Crypto has highlighted what is a textbook head and shoulders formation on the daily chart. This bearish pattern, if completed, would imply a breakdown toward the $96,000 price zone, according to the analyst.
Related Reading
The setup is clearly defined by a peak (head) around mid-May that is flanked by two lower highs (shoulders) on either side, all sitting atop a slanted neckline that now acts as the last line of support. As of now, Bitcoin is trading just above this neckline, testing its structural integrity.
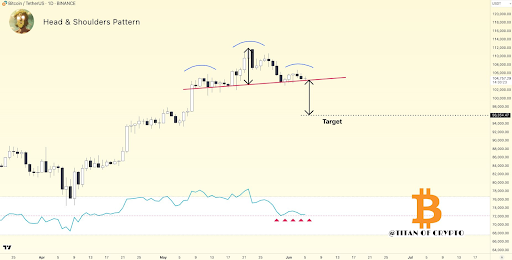
In technical analysis, a clean break below the neckline accompanied by strong volume often activates the measured move from the head’s peak to the neckline, projected downward. Based on the chart, that drop points directly to $96,054. This puts Bitcoin at risk of a near 8% drawdown from current levels, with little support in between.
Aside from this formation, Bitcoin’s daily RSI is currently around the 50 reading, which is a zone that often triggers reactions. As such, a drop below this midline will confirm a bearish shift in momentum.
Bitcoin Price Action Closing On Bearish Mode
If Bitcoin does collapse toward the $96,000 level, it would mark a departure from the bullish strength that dominated its price just two weeks ago when it registered a new all-time high at $111,814. Since then, however, Bitcoin has lost subsequent support levels at $110,000, $107,000, and $105,000, which now places the next zone of importance at $103,000. Should Bitcoin fail to hold above that threshold, the pressure would likely shift toward the $101,000 level, which could act as the final buffer before steeper declines.
Related Reading
Interestingly, the neckline level of the inverse head and shoulders pattern highlighted by crypto analyst Titan of Crypto is around the $103,500 price level. Bitcoin broke below this price level in the past 24 hours, but the bulls managed to prevent further losses below $101,700. This has led to the creation of lower lows on the daily timeframe.
At the time of writing, Bitcoin is trading at $103,250, which means it is back to testing the neckline resistance from below. Its reaction here would determine if it eventually crashes toward $96,000. If sellers take control at this level, it would not only confirm the head and shoulders breakdown but could also lead to a short-term capitulation across other cryptocurrencies.
Featured image from Getty Images, chart from Tradingview.com