Close Menu
    Facebook X (Twitter) Instagram
    • Privacy Policy
    • Terms Of Service
    • Social Media Disclaimer
    • DMCA Compliance
    • Anti-Spam Policy
    Facebook X (Twitter) Instagram
    Fintech Fetch
    • Home
    • Crypto News
      • Bitcoin
      • Ethereum
      • Altcoins
      • Blockchain
      • DeFi
    • AI News
    • Stock News
    • Learn
      • AI for Beginners
      • AI Tips
      • Make Money with AI
    • Reviews
    • Tools
      • Best AI Tools
      • Crypto Market Cap List
      • Stock Market Overview
      • Market Heatmap
    • Contact
    Fintech Fetch
    Home»Crypto News»Bitcoin»A Single Bitcoin Price Point That Influences Everything
    Bitcoin Price Analysis
    Bitcoin

    A Single Bitcoin Price Point That Influences Everything

    November 15, 20254 Mins Read
    Share
    Facebook Twitter LinkedIn Pinterest Email
    changelly

    The Bitcoin price has dropped sharply this month. Since early November, it has fallen almost 15%, turning one of the strongest assets of the year into one of the weakest in the current pullback.

    The drop has pushed the market into two camps again. Some believe this is the start of a deeper correction. Others believe the cycle is still unfolding, and this is merely an oversized dip. The next move depends on one level. If Bitcoin reclaims it, the rebound setup activates. If it fails there, the downside can widen fast.

    Bitcoin Momentum Softens the Fall, but One Level Must Validate It

    There are early signs that sellers may be losing strength.

    The Relative Strength Index entered the oversold zone this week and has since reversed. That usually shows that selling pressure is easing.

    A longer-term pattern also supports that view. Between April 30 and November 14, Bitcoin price formed a higher low, which means the broader trend is not fully broken. However, over the same period, the RSI also made a lower low. This is a hidden bullish divergence, a signal that often appears when a strong trend is attempting to resume after a significant correction.

    synthesia

    For the RSI sign to play out, the Bitcoin price must cross above $100,300 (a key support since late April), which might now act as a psychological resistance.

    Bitcoin Sellers Might Be Getting Weaker: TradingView

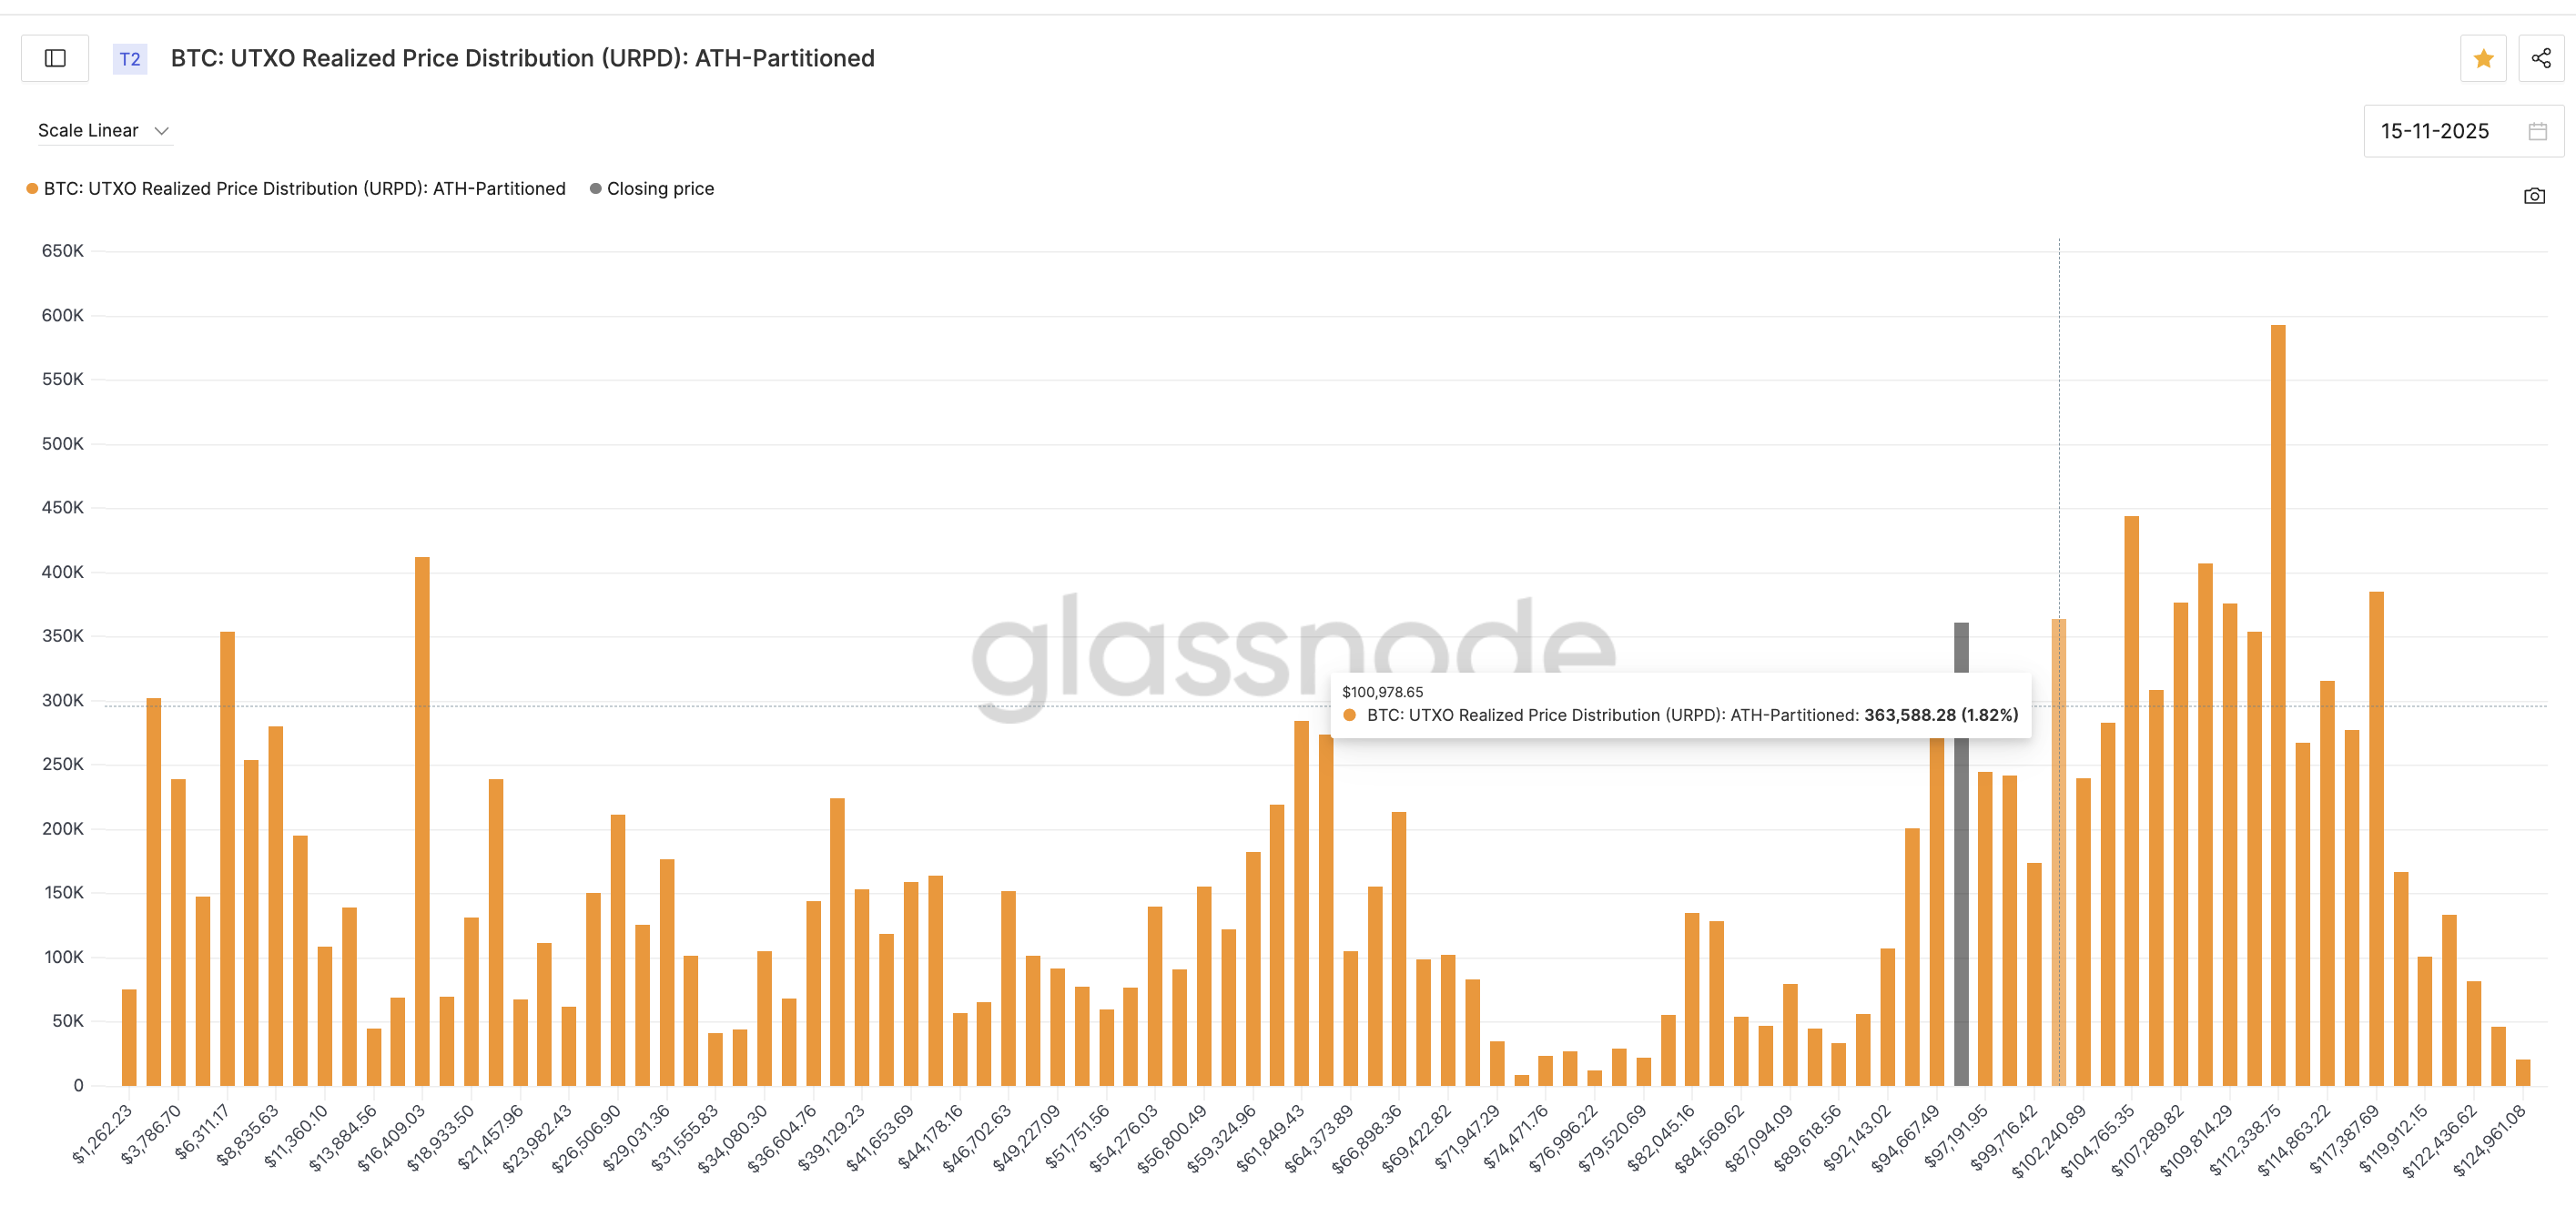
    Supply data points to the same area on the chart. The UTXO Realized Price Distribution shows a large band of long-term Bitcoins created near the $100,900 zone.

    When a cluster like this forms, it often becomes a significant decision point because a large portion of the supply is at the same cost basis. This cost-basis cluster falls near the resistance level highlighted on the RSI chart.

    Bitcoin Supply Zones
    Bitcoin Supply Zones: Glassnode

    This is why the momentum story only matters if the BTC price closes back above that region. Without that close, the divergence and oversold readings remain unconfirmed.

    A One-Year Low in NUPL Keeps the Bottoming Case Alive

    The second argument for a rebound comes from the Net Unrealized Profit/Loss metric.

    NUPL has now dropped to 0.40, its lowest reading in a year. This means the market is back to holding very thin unrealized profits, similar to early-cycle periods.

    The last time NUPL hit a comparable low was in April. From there, Bitcoin climbed roughly 46% in less than two months. While this does not guarantee a repeat, it shows the market is entering a familiar pressure zone where rebounds often form if the price can stabilize.

    Bottom Theory Remains Active
    Bottom Theory Remains Active: Glassnode

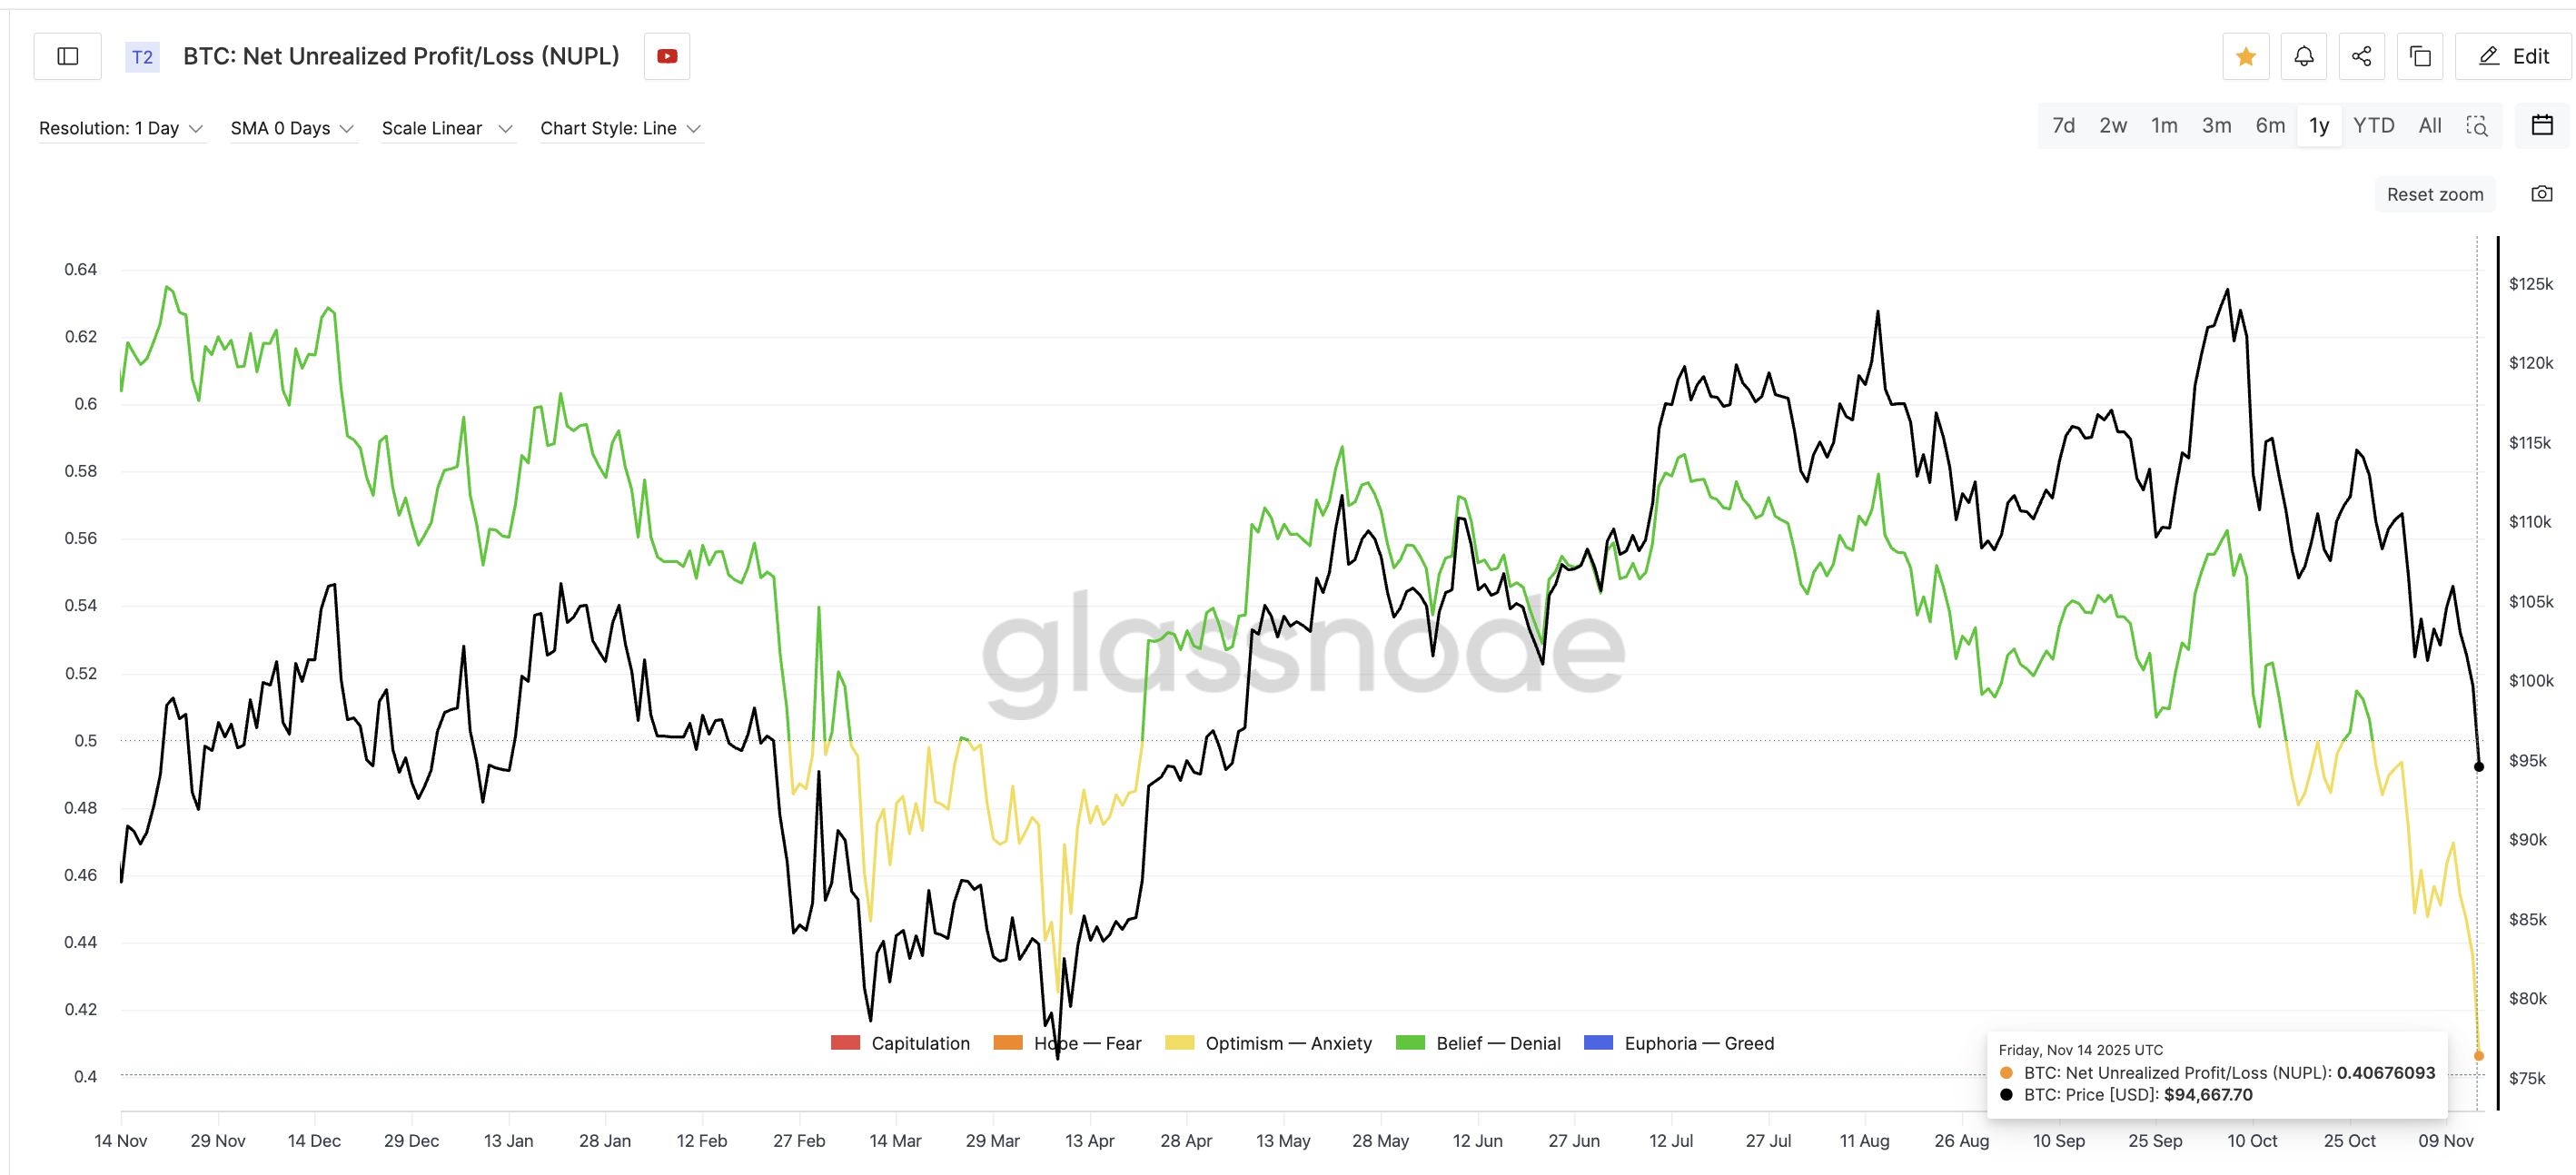
    But again, this indicator also depends on price reclaiming the same resistance band. Without that, the Bitcoin bottoming theory stays open but inactive.

    Bitcoin Price Trades in a Falling Channel — With Two Critical Levels In Sight

    Bitcoin remains within a falling channel, maintaining a bearish short-term trend.

    The first step out of it is simple: regain $100,300. A daily close above $101,600 strengthens the move and flips the old support back into support.

    If that happens, the next important level sits near $106,300. Breaking above it would push Bitcoin out of the falling channel. That would shift the trend from bearish to neutral and could turn it bullish if momentum improves.

    Bitcoin Price Analysis
    Bitcoin Price Analysis: TradingView

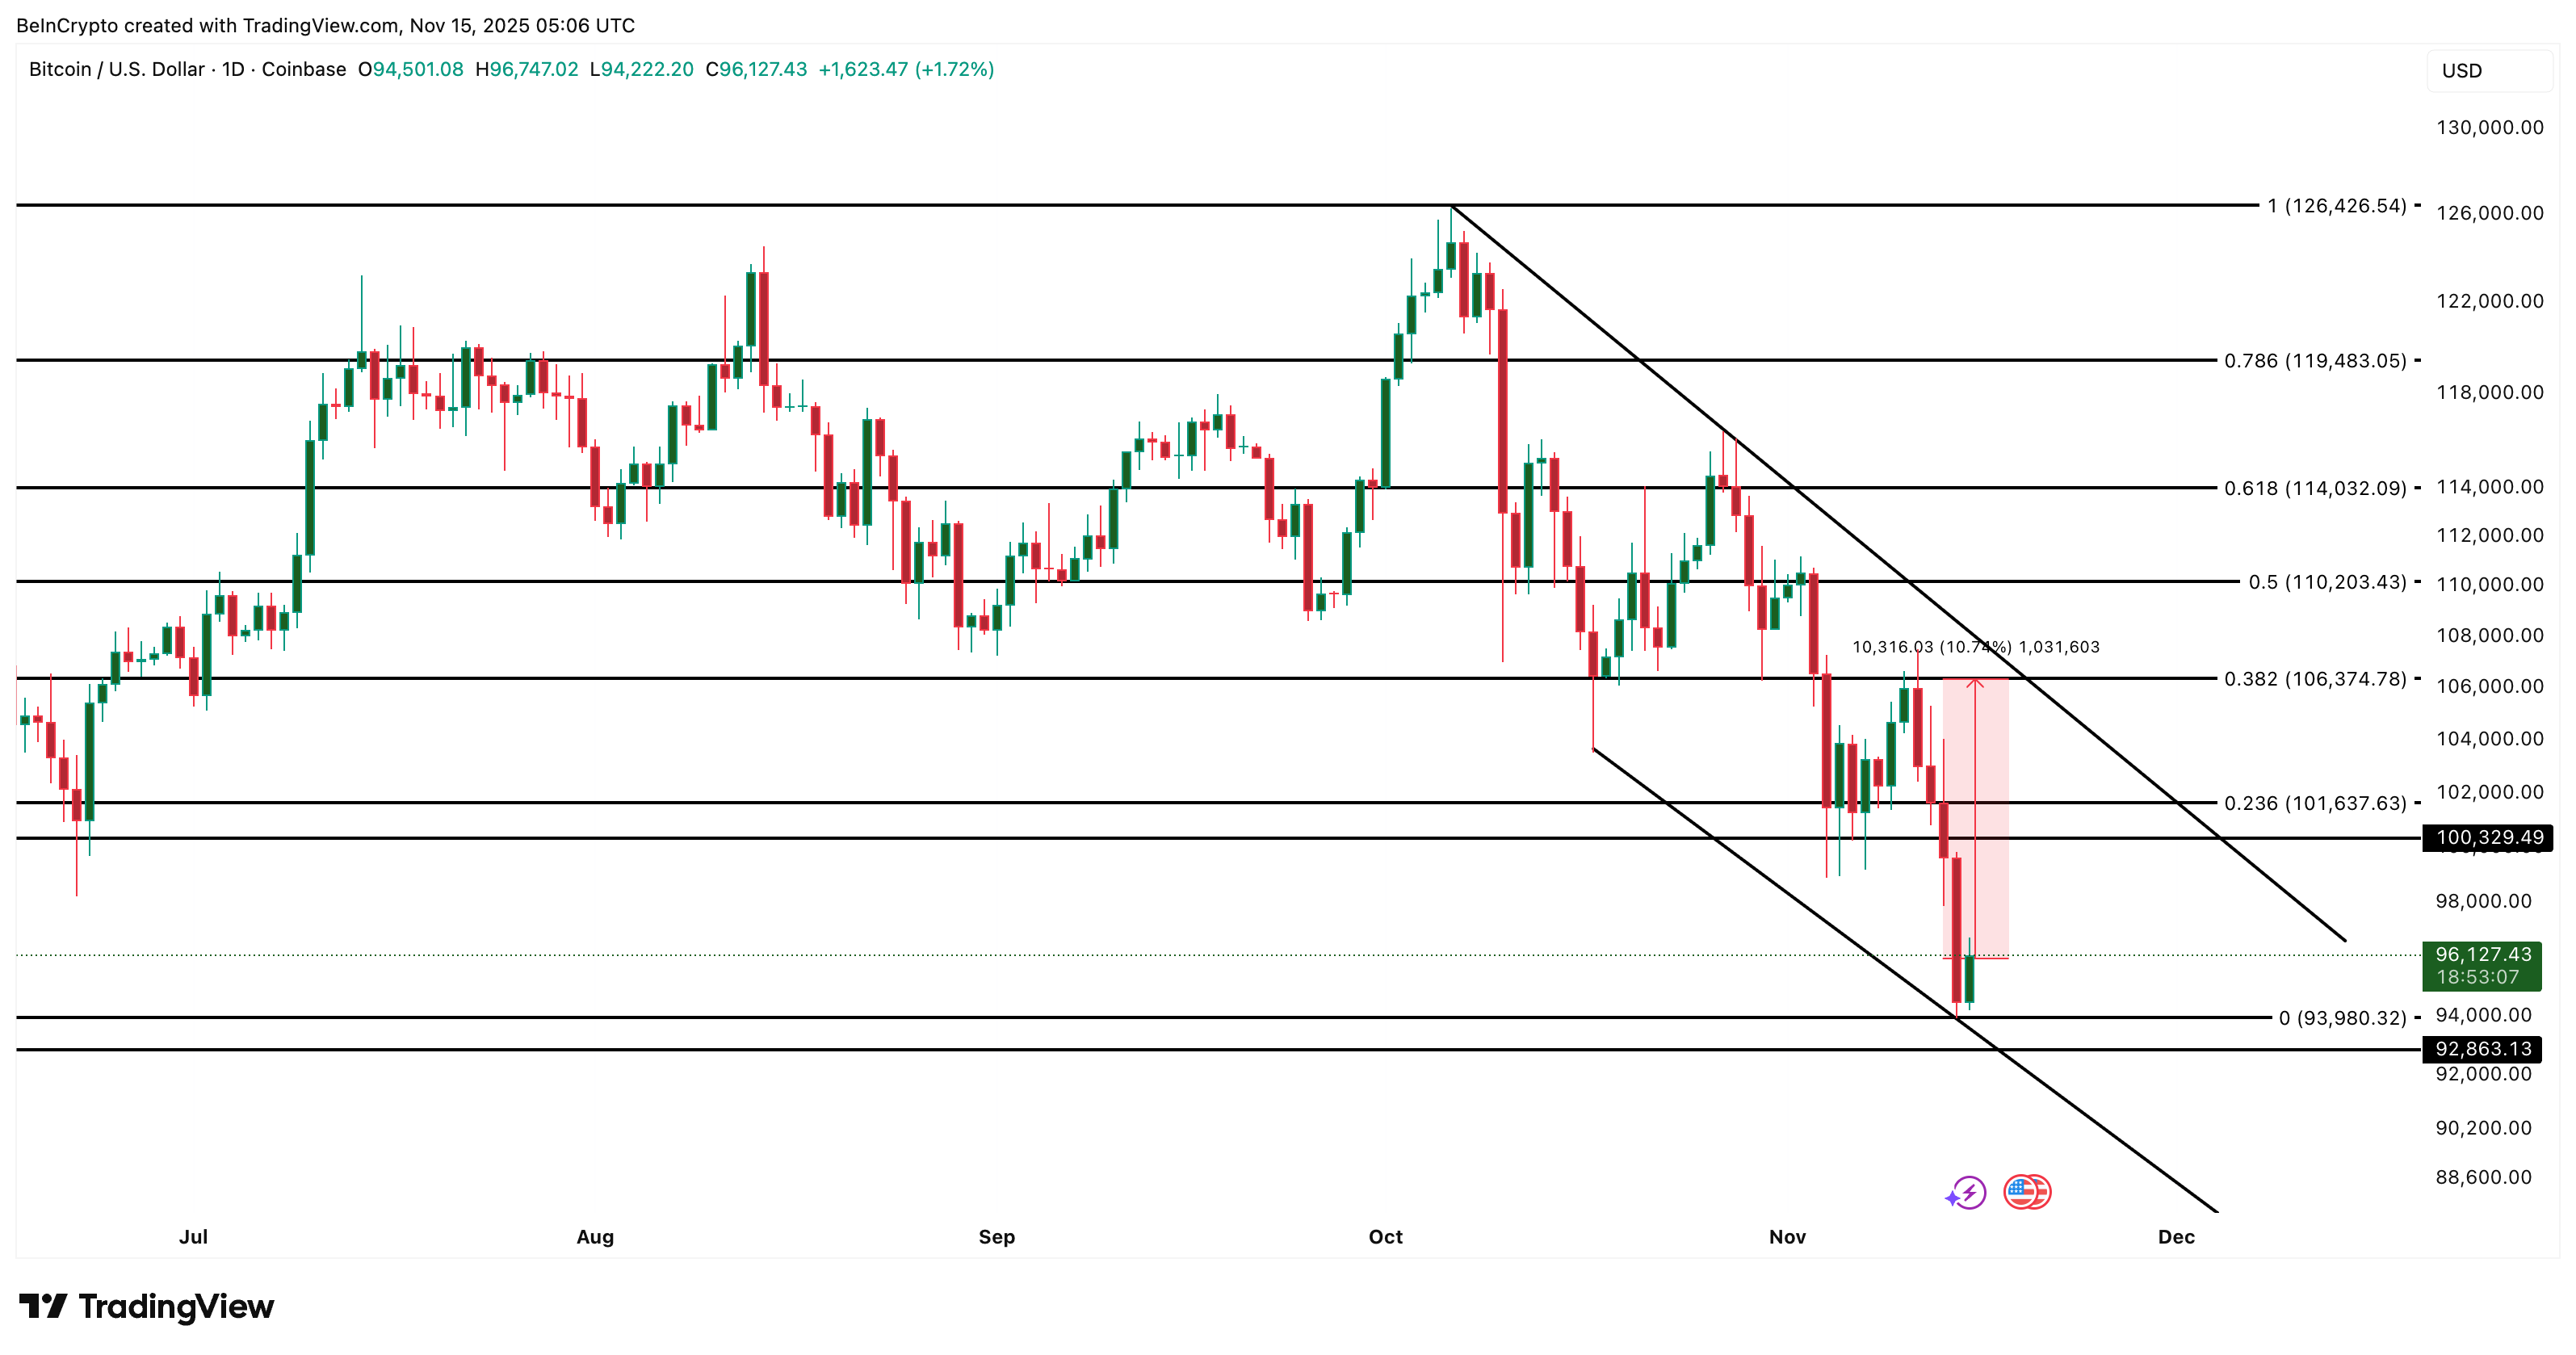
    The bust risk sits underneath. The lower band of the channel only has two clean touches, which makes it structurally weak. If Bitcoin loses $93,900–$92,800, the pattern opens deeper levels, and the “extended cycle” view becomes much harder to defend.

    Right now, everything rests on one decision point. Above $100,300, the Bitcoin price stabilizes. Below $93,900, the slide can get much worse.

    coinbase
    Share. Facebook Twitter Pinterest LinkedIn Tumblr Email
    Fintech Fetch Editorial Team
    • Website

    Related Posts

    Bitcoin Mining Difficulty Drops 7.7% in Biggest Cut Since February

    Bitcoin Mining Difficulty Decreases by 7.7%, Marking Largest Reduction Since February

    March 21, 2026
    Bitcoin

    What is the Lowest Possible Bitcoin Price? Analyst Discusses Worst-Case Outlook

    March 21, 2026
    BitFuFu Cuts Self-Mined Bitcoin by 60% in 2025

    BitFuFu Reduces Self-Mined Bitcoin Production by 60% in 2025

    March 20, 2026
    Bitcoin price

    Jane Street Resumes Bitcoin Trading: Essential Insights on This Key Market Participant

    March 20, 2026
    Add A Comment

    Comments are closed.

    Join our email newsletter and get news & updates into your inbox for free.


    Privacy Policy

    Thanks! We sent confirmation message to your inbox.

    aistudios
    Latest Posts
    From FOMO to Apathy: Altcoin Volumes Reflect Deepening Market Fatigue

    From Fear of Missing Out to Indifference: Altcoin Trading Volumes Show Growing Market Weariness

    March 21, 2026
    OpenAI Drops IH-Challenge Dataset to Harden AI Against Prompt Injection Attacks

    OpenAI Releases IH-Challenge Dataset to Strengthen AI Defenses Against Prompt Injection Attacks

    March 21, 2026
    Onchain Data Says Ether May Have Bottomed: Will Traders Buy?

    Onchain Insights Indicate Ether Might Have Reached Its Low: Will Traders Step In?

    March 21, 2026
    stocks climbing green bull market

    Top TSX Stocks to Invest in Now for Income and Growth Potential

    March 21, 2026
    Three ways AI is learning to understand the physical world

    Three ways AI is learning to understand the physical world

    March 21, 2026
    kraken
    LEGAL INFORMATION
    • Privacy Policy
    • Terms Of Service
    • Social Media Disclaimer
    • DMCA Compliance
    • Anti-Spam Policy
    Top Insights
    How To Make Money With Google Adsense Using AI (No-Code Web Apps)

    How To Make Money With Google Adsense Using AI (No-Code Web Apps)

    March 21, 2026
    Five AI Projects for 2026

    Five AI Projects for 2026

    March 21, 2026
    synthesia
    Facebook X (Twitter) Instagram Pinterest
    © 2026 FintechFetch.com - All rights reserved.

    Type above and press Enter to search. Press Esc to cancel.