

Want more housing market stories from Lance Lambert’s ResiClub in your inbox? Subscribe to the ResiClub newsletter.
In early October, a post on X by FreightWaves founder and CEO Craig Fuller caught my attention:
While Fuller’s narrative rings true in some pockets of the country, it isn’t the case everywhere. The dynamics he describes—strong demand at the low end, softness in the middle—reflect certain regional realities, but not necessarily what’s unfolding across the broader Southeast housing market.
According to my reporting and research, there’s currently a lot of variation by price tier. Several Southeast homebuilders have told me they’ve actually seen greater softening in the entry-level segment over the past year—the very segment many builders have been chasing. Some rolled out smaller floor plans or trimmed square footage to entice priced-out homebuyers, but those efforts are now meeting slower demand. Meanwhile, the higher tiers have held up better.
Part of that cooling stems from simple oversupply and stretched affordability. Builders across the Southeast ramped up production of smaller, sub-$350,000 homes in 2023 and early 2024. But elevated insurance premiums, rising property taxes, and household budget fatigue have since taken a toll, especially in Florida and parts of Georgia.
This month, I launched the ResiClub Terminal—a new platform that includes analysis by home-price tier: lower-tier (5th to 35th percentile), middle-tier (35th to 65th percentile), and upper-tier (65th to 95th percentile) homes, all broken out by market. That tiered data confirms what Southeast builders are reporting: The lower end of the market has shown the greatest weakness over the past year across much of the region.
Lower-tier home price year-over-year change 👇
Upper-tier home price year-over-year change 👇
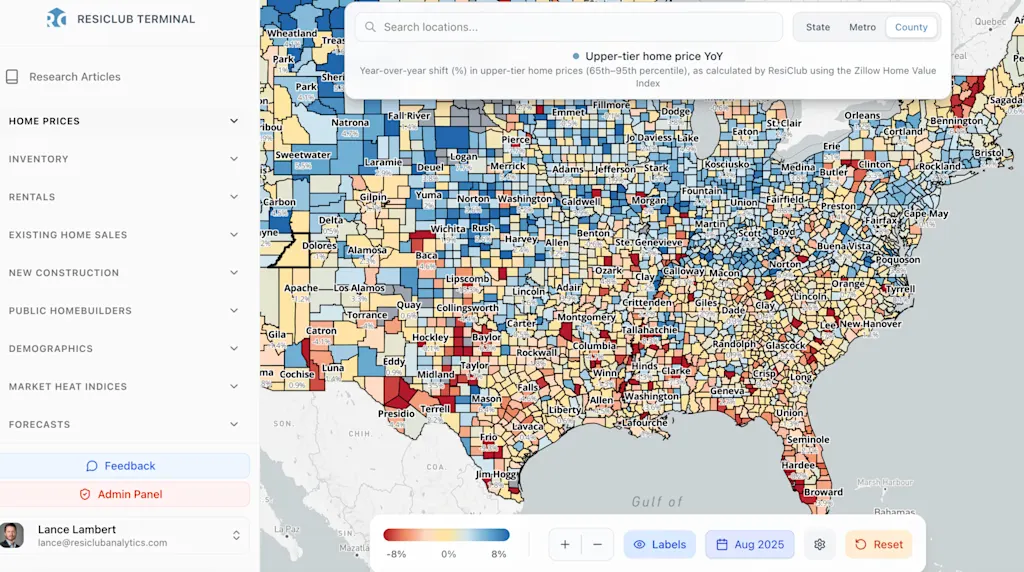
Within the ResiClub Terminal, ResiClub PRO members can click on individual markets to see this data down to a local level. For example:
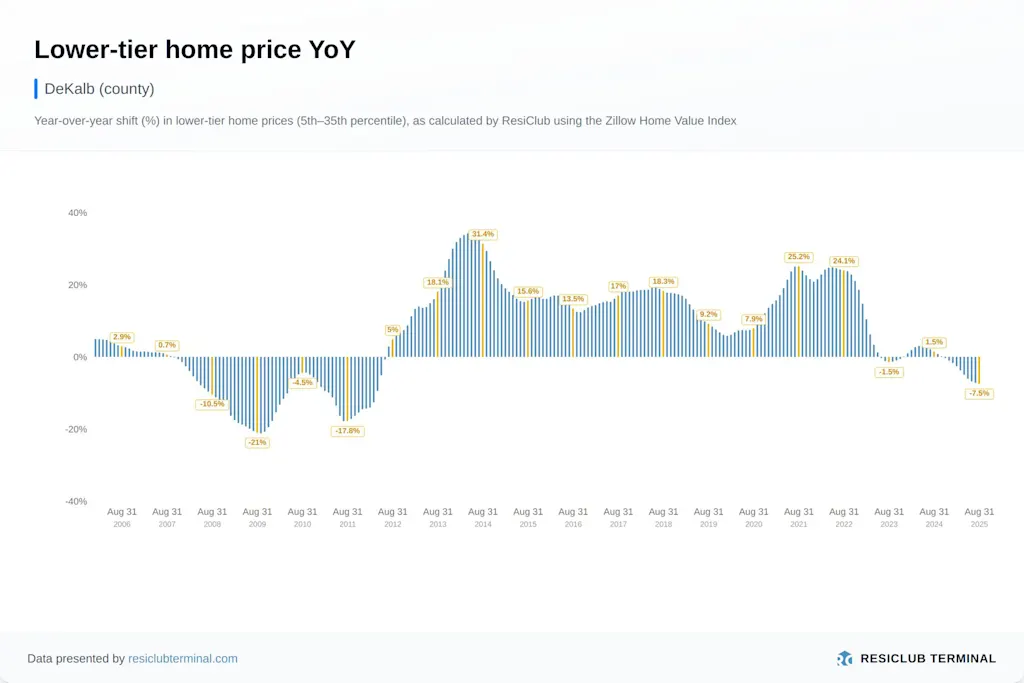
Lower-tier home prices are down 7.5% year over year in DeKalb County, Georgia.
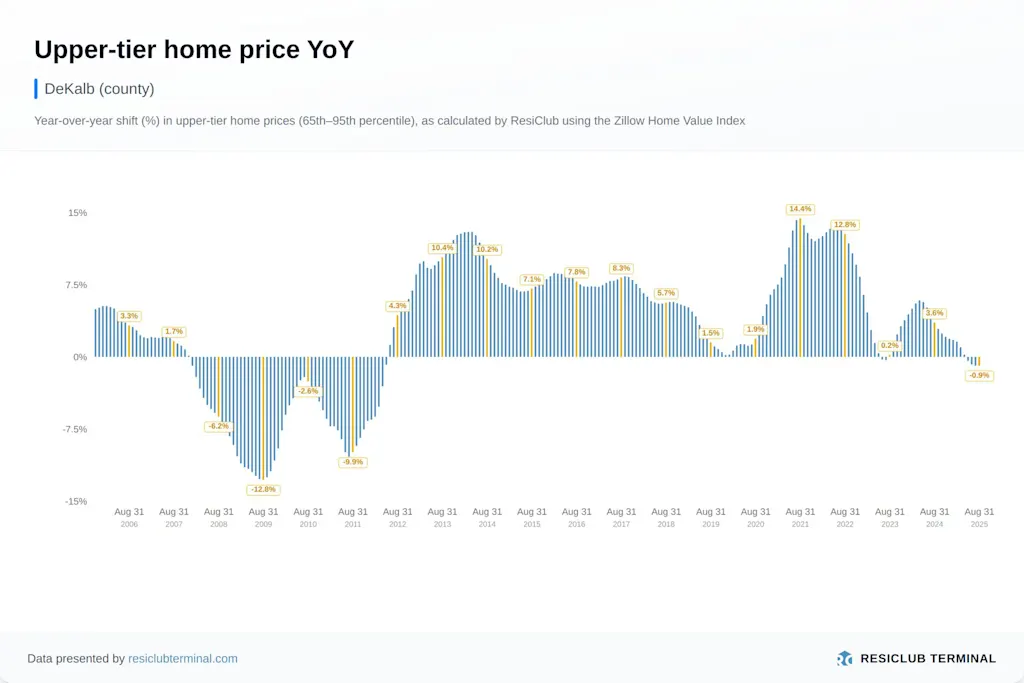
Upper-tier home prices are down 0.9% year over year in DeKalb County, Georgia.
When you zoom out and look at this on a nationally aggregated basis, the upper-tier, middle-tier, and lower-tier stats are all pretty close.
- Upper tier: -0.1%
- Middle tier: +0.2%
- Lower tier: +0.6%
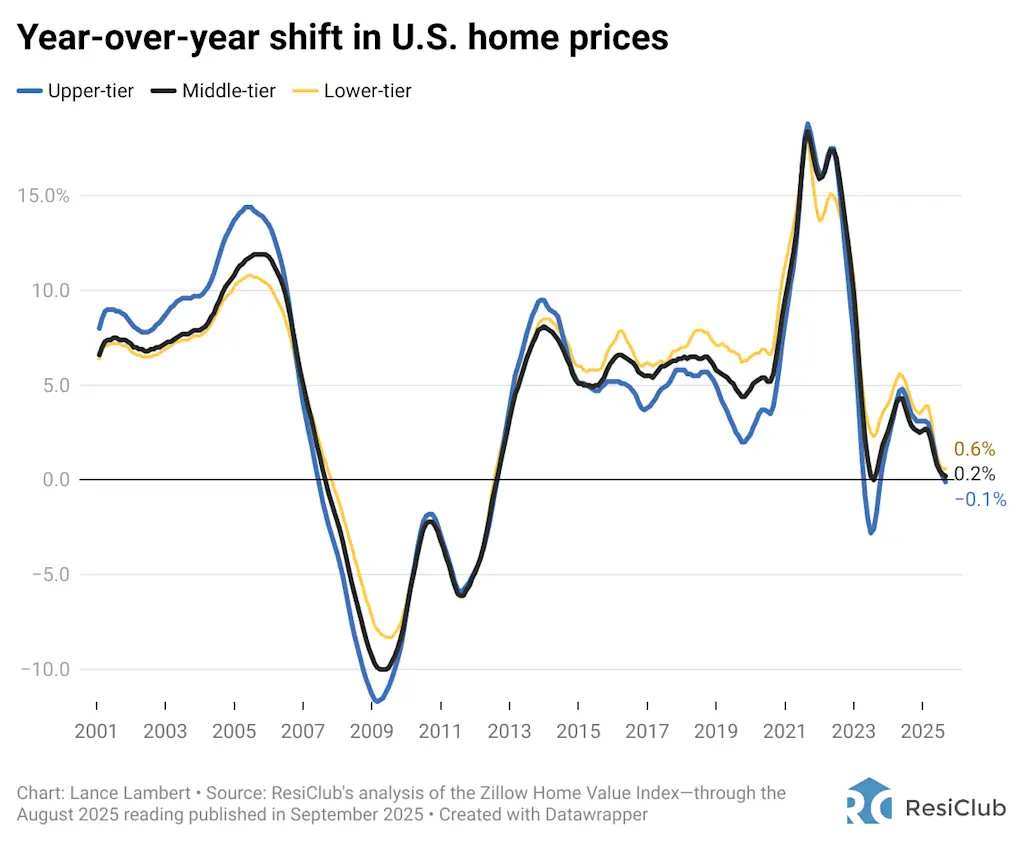
The fact that current housing market dynamics by price tier are nearly identical on a nationally aggregated basis—despite significant underlying variation—is a reminder that it’s important for housing stakeholders to have accurate, localized information.