Close Menu
FintechFetch
    FintechFetch
    • Home
    • Fintech
    • Financial Technology
    • Credit Cards
    • Finance
    • Stock Market
    • More
      • Business Startups
      • Blockchain
      • Bitcoin News
      • Cryptocurrency
    FintechFetch
    Home»Blockchain»BNB Bulls Target $644 As Classic Chart Formation Emerges
    Blockchain

    BNB Bulls Target $644 As Classic Chart Formation Emerges

    FintechFetchBy FintechFetchMay 5, 2025No Comments3 Mins Read
    Share Facebook Twitter Pinterest LinkedIn Tumblr Reddit Telegram Email
    Share
    Facebook Twitter LinkedIn Pinterest Email


    Binance Coin (BNB) is gaining fresh interest as investors closely watch a potential breakout. The token is facing resistance around $593, with daily trade volume at $1.24 billion. Its market cap is $83 billion. The current trend is being attributed to sustained buying interest and continuous technical cues.

    Traders Identify Triangle Pattern On BNB Chart

    Technical analysts are keenly watching a triangle price pattern forming on the chart of BNB against USDT’s 1-day chart. As analyst Andrew Griffiths explains, this formation is recognized for contracting price action, whereby the highs become lower and the lows become higher. It typically indicates a significant move in the near future, either higher or lower.

    #BNB analysis on the 1D chart vs USDT shows price movement within a triangle pattern, indicating room for the current side trend. Potential targets: T1 = $599, T2 = $617, T3 = $644. For risk management, consider Stop-Loss levels: SL1 = $580, SL2 = $559, SL3 = $542, SL4 = $521.… pic.twitter.com/Qku1eChZ4R

    — Andrew Griffiths (@AndrewGriUK) May 3, 2025

    The graph indicates BNB trending in a narrower range for the past few sessions. Such a setup typically indicates that there is a breakout on the horizon. As BNB has been on an upward trend prior to this pattern forming, some assume it will keep going up—if the support zones hold. However, a breach below those support levels might reverse the trend and push the price down.

    Price Targets Established At $599, $617, And $644

    If BNB keeps surging, analysts have cited three possible targets. The first is $599, which is just below the psychological barrier of $600. The second is $617, a place where BNB fought to move above back in March.

    The third is $644, which is the entire range of the triangle formation. These will likely be checkpoints if there is momentum.

    Although short-term bullish indications are there, the token has not yet breached any of these levels. For now, BNB is probing a significant level of support and resisting. This type of price action is typical before bigger moves in either direction.

    BNB: The 32% Prediction

    In spite of all the short-term hype, a different forecast shows BNB plummeting in the next year. Based on a price forecast, the token might decline by 32% and hit $402 on June 4, 2025. That prediction doesn’t coincide with the existing chart strength, creating an extra layer of uncertainty for long-term investors.
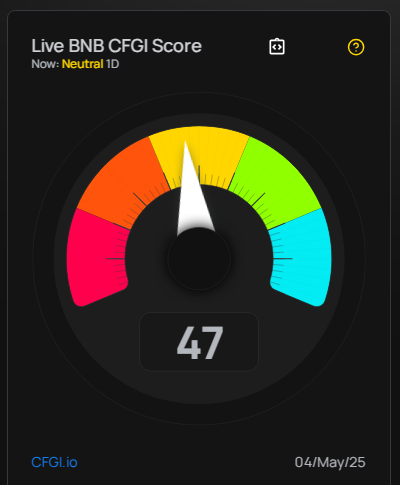
    BNB has experienced 15 green days out of the past 30, and its price volatility has been only 2.5%. The sentiment of the market seems to be neutral for the time being, with the Fear & Greed Index standing at 52. Everyone is still focused on the triangle formation and if BNB will extricate itself from it.

    Featured image from Gemini Imagen, chart from TradingView


    Source link

    Share. Facebook Twitter Pinterest LinkedIn Tumblr Email
    Previous ArticleWhen You Don’t Want Your Kids To Be Just Like You
    Next Article £5,000 invested in Legal & General shares 10 years ago would have generated passive income of…
    FintechFetch
    • Website

    Related Posts

    Blockchain

    Bitcoin Short-Term Holders Are Capitulating—Will June Pattern Repeat?

    August 7, 2025
    Blockchain

    Sei Network Gets MetaMask Support as Buy Signals Emerge for SEI Token, $0.5 on the Horizon

    August 7, 2025
    Blockchain

    Bitcoin STH Realized Price Signals Fragile Support: Correction Risk Intensifies

    August 7, 2025
    Add A Comment
    Leave A Reply Cancel Reply

    Top Posts

    After an incredible Q4, this top growth stock just jumped 15% today! 

    February 26, 2025

    WW3 Imminent: Is the India and Pakistan War Time to Sell?

    May 8, 2025

    XRP April Target Of $8 To $13 ‘Still Stands,’ Says Crypto Analyst

    April 8, 2025

    3 reasons to consider buying Alphabet shares in August

    August 1, 2025

    Bitcoin Blasts Past $98,000: Is $100K Next, Or A Trap?

    February 21, 2025
    Categories
    • Bitcoin News
    • Blockchain
    • Business Startups
    • Credit Cards
    • Cryptocurrency
    • Finance
    • Financial Technology
    • Fintech
    • Stock Market
    Most Popular

    Cardano (ADA) Pressure Mounts—More Downside on the Horizon?

    April 16, 2025

    XRP Price Flashes Symmetrical Triangle From 2017, A Repeat Could Send It as Flying To $30

    April 11, 2025

    XRP Price Moves Up — Hurdles Ahead Could Limit Gains

    July 3, 2025
    Our Picks

    Is It Finally Time to PUMP? PUMP Price Analysis Shifts Bullish Amid Bitcoin Strength

    August 7, 2025

    Crypto Analysts Spot Bullish Signal: Ethereum Targets $5K Milestone

    August 7, 2025

    How much do you need in a SIPP to target a £1,250 monthly second income?

    August 7, 2025
    Categories
    • Bitcoin News
    • Blockchain
    • Business Startups
    • Credit Cards
    • Cryptocurrency
    • Finance
    • Financial Technology
    • Fintech
    • Stock Market
    • Privacy Policy
    • Disclaimer
    • Terms and Conditions
    • About us
    • Contact us
    Copyright © 2024 Fintechfetch.comAll Rights Reserved.

    Type above and press Enter to search. Press Esc to cancel.