Close Menu
FintechFetch
    FintechFetch
    • Home
    • Fintech
    • Financial Technology
    • Credit Cards
    • Finance
    • Stock Market
    • More
      • Business Startups
      • Blockchain
      • Bitcoin News
      • Cryptocurrency
    FintechFetch
    Home»Blockchain»Ethereum Weekly Candle Hints At Pre-Tower Top Formation – Details
    Blockchain

    Ethereum Weekly Candle Hints At Pre-Tower Top Formation – Details

    FintechFetchBy FintechFetchJune 15, 2025No Comments4 Mins Read
    Share Facebook Twitter Pinterest LinkedIn Tumblr Reddit Telegram Email
    Share
    Facebook Twitter LinkedIn Pinterest Email


    Reason to trust

    Strict editorial policy that focuses on accuracy, relevance, and impartiality

    Created by industry experts and meticulously reviewed

    The highest standards in reporting and publishing

    Strict editorial policy that focuses on accuracy, relevance, and impartiality

    Morbi pretium leo et nisl aliquam mollis. Quisque arcu lorem, ultricies quis pellentesque nec, ullamcorper eu odio.

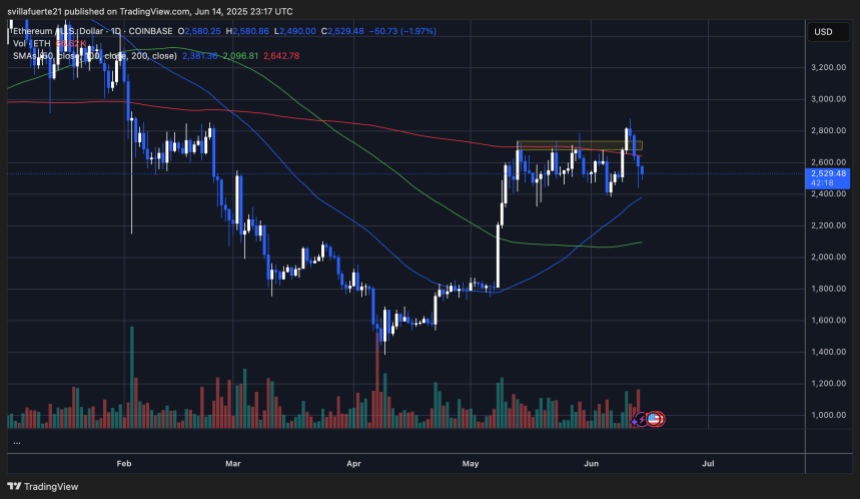
    Ethereum is trading at a critical juncture after intense volatility rocked the broader market following renewed conflict in the Middle East. After pushing above the $2,800 resistance earlier this week, ETH bulls appeared to regain control. However, the price action failed to hold above that level, pulling back sharply and signaling hesitation among market participants.

    Related Reading

    This retracement comes as macroeconomic and geopolitical tensions rise, particularly after Israel’s strike on Iran triggered widespread risk-off sentiment across global assets. Ethereum, often seen as a high-beta asset, has not been immune to the turbulence. Despite this, it continues to hover near important technical zones, maintaining the potential for a larger move in either direction.

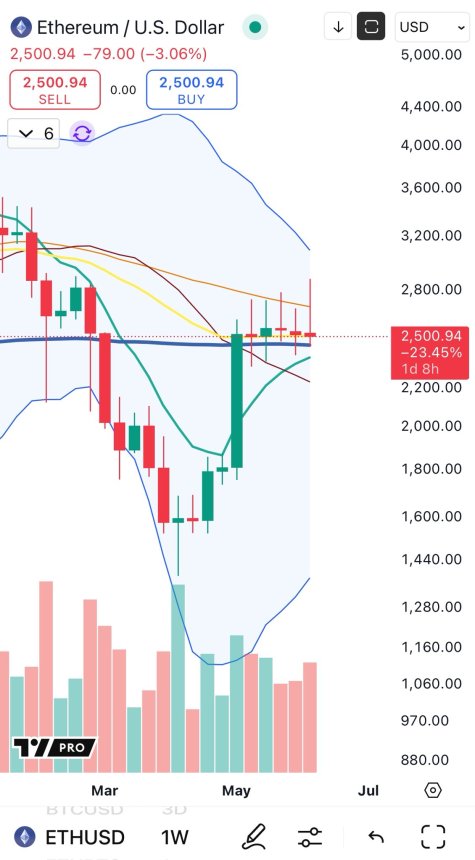
    Top analyst Big Cheds weighed in on the situation, highlighting a notable technical pattern: ETH is flexing another small body with an upper shadow on the weekly chart. This suggests indecision and potential weakness at the top, although the structure is not yet fully compromised. The next few daily candles could be pivotal in defining Ethereum’s short-term trend. Bulls must reclaim $2,800 with conviction to re-establish momentum, while further downside could open the door for a deeper correction toward previous consolidation zones.

    Ethereum Holds Range As Market Awaits Next Move

    Ethereum has lost over 15% since last Wednesday, retracing from local highs near $2,830 and falling back into the trading range that has held since early May. Despite the drop, ETH remains structurally intact, still respecting the broader consolidation zone. However, price action continues to stall below the $2,770 resistance, keeping traders and analysts split on the next move.

    Some market participants believe Ethereum could ignite the next altcoin season if it manages to break above its current range with conviction. A decisive close above $2,800 could reestablish bullish momentum and signal capital rotation from Bitcoin into ETH and broader altcoins. Others remain cautious, pointing to weakening momentum, global instability, and a failure to sustain support as early warning signs of a potential breakdown below the $2,500–$2,550 area.

    Adding to the analysis, Cheds shared a technical perspective showing that Ethereum’s weekly chart is printing yet another small-bodied candle with an upper shadow. This structure is consistent with what he sees as a “pre-tower top” setup — a pattern that often precedes heightened volatility or a reversal. It highlights the market’s current hesitation and the ongoing battle between buyers and sellers.

    Ethereum forms a bearish pattern (1-week) | Source: Big Cheds on X
    Ethereum forms a bearish pattern (1-week) | Source: Big Cheds on X

    Macroeconomic conditions are not helping either. Rising US Treasury yields continue to pressure risk assets, while ongoing geopolitical turmoil—especially the escalating conflict between Israel and Iran—adds another layer of volatility and fear across financial markets.

    Related Reading

    ETH Struggles To Hold Breakout

    Ethereum is trading at a critical juncture after failing to hold the breakout above the $2,770 level. The chart shows ETH slipping back into its prior range, with price now testing support around $2,530 after a sharp intraday decline. This move follows a failed breakout attempt, as the price was rejected near the 200-day moving average, currently acting as dynamic resistance just below $2,650.

    ETH holds current price range | Source: ETHUSDT chart on TradingView
    ETH holds current price range | Source: ETHUSDT chart on TradingView

    The volume spike on the recent sell-off confirms strong bearish interest, increasing downside pressure. ETH is now sitting close to the lower end of a trading range that has persisted since early May. A decisive break below $2,500 could open the door for a drop toward the 50-day moving average near $2,380. This would put Ethereum on a path to retest earlier consolidation levels.

    Related Reading

    On the upside, bulls must reclaim the $2,650–$2,770 resistance zone and establish a higher low to revive bullish momentum. Failing to do so will likely keep Ethereum range-bound or push it lower amid ongoing macroeconomic and geopolitical uncertainty.

    Featured image from Dall-E, chart from TradingView


    Source link

    Share. Facebook Twitter Pinterest LinkedIn Tumblr Email
    Previous ArticleModifying the principles of Open Banking for Global South Markets: By Kaustuv Ghosh
    Next Article How many Legal & General shares must an investor buy to earn £1k of monthly passive income?
    FintechFetch
    • Website

    Related Posts

    Blockchain

    Chainlink Targets $22 As LINKBTC Shows Signs Of Reversal – Is The Next Rally Close?

    September 28, 2025
    Blockchain

    Here’s The Explosion That Will Send Price To $1.3

    September 28, 2025
    Blockchain

    Bitcoin Fear & Greed Index Crashes To Lowest Level Since March, Why This Is Good News

    September 28, 2025
    Add A Comment
    Leave A Reply Cancel Reply

    Top Posts

    SUI, SOL Headline $484M Token Unlock Wave This Week

    June 30, 2025

    Just released: February’s higher-risk, high-reward stock recommendation [PREMIUM PICKS]

    February 12, 2025

    Dogecoin Price Tests Panic Zone At $0.21, Breakdown Could Lead To Price Crash

    May 18, 2025

    Here’s why the Standard Chartered share price jumped 5% on FY results

    February 22, 2025

    DBS Banking Masterstroke Coming to an End Under Piyush Gupta

    March 26, 2025
    Categories
    • Bitcoin News
    • Blockchain
    • Business Startups
    • Credit Cards
    • Cryptocurrency
    • Finance
    • Financial Technology
    • Fintech
    • Stock Market
    Most Popular

    BTC USD Speculators at Max Pain, Bitcoin Whales Unfazed: Stack Over $25B in 5 Months

    August 21, 2025

    VivoPower Unveils $30M XRP Yield Program With Doppler, Plans $200M Expansion

    September 3, 2025

    Chainlink Price Continues To Hover Around $12.5 — Levels To Watch

    April 19, 2025
    Our Picks

    Here’s How Bitcoin Can Shoot for a New All-Time High Despite Weekly Crash

    September 28, 2025

    Up 334% in a year, this fledgling energy company might not be a penny stock for long!

    September 28, 2025

    Chainlink Targets $22 As LINKBTC Shows Signs Of Reversal – Is The Next Rally Close?

    September 28, 2025
    Categories
    • Bitcoin News
    • Blockchain
    • Business Startups
    • Credit Cards
    • Cryptocurrency
    • Finance
    • Financial Technology
    • Fintech
    • Stock Market
    • Privacy Policy
    • Disclaimer
    • Terms and Conditions
    • About us
    • Contact us
    Copyright © 2024 Fintechfetch.comAll Rights Reserved.

    Type above and press Enter to search. Press Esc to cancel.