

Financial markets are experiencing an unusual divergence as gold prices remain stagnant despite a sharp decline in the US dollar.
Typically, gold and the dollar share an inverse relationship, making this market behavior particularly puzzling. With President Trump’s aggressive new tariffs escalating global trade tensions, investors are left grappling with an increasingly complex landscape.
A rapidly declining dollar raises questions
The US dollar has seen a steep decline over the past week, catching market observers off guard. The dollar index, which started
the week at 107.34, has tumbled significantly:
Monday: A 0.95% drop brought it
down to 106.48.
Tuesday: Another 0.91% decline
pushed it to 105.51.
Wednesday: A sharper 1.18% plunge
landed it at 104.26, its lowest level since December 2023.
This rapid depreciation coincides with the introduction of sweeping tariffs on major US trading partners. As of midnight Tuesday,
a 25% import tariff on goods from Mexico and Canada was enacted, alongside an increased 20% levy on
Chinese imports.
These aggressive trade measures have triggered swift retaliatory actions. Canada has imposed tariffs on over $100 billion worth
of US goods, China has implemented countervailing tariffs of up to 15% on US agricultural exports, and Mexico is expected to announce countermeasures by Sunday.
The economic repercussions of these escalating trade tensions are becoming evident. Analysts warn that a full-fledged trade
war could lead to slower global growth and rising inflation, potentially delaying the much-anticipated Federal Reserve interest rate cuts.
President Trump, in a Congressional address on Tuesday, hinted at further trade penalties set for April 2, including additional
“reciprocal tariffs” and non-tariff barriers aimed at addressing what he describes as “decades of unfair trade imbalances.”
Both the dollar and gold reacted strongly to Wednesday’s
ADP
private-sector employment report, which showed a concerning slowdown in hiring. Only 77,000 new jobs were added in the previous month-well below January’s 186,000 and far short of the projected 142,500.
Source: ADP
The Federal Reserve Bank of Atlanta’s GDPNow model has now revised its forecast, projecting a 2.8% contraction in US GDP for
the first quarter.

Source: Atlantafed
With the economy showing signs of slowing while tariffs drive up inflation, concerns over stagflation-a rare mix of
stagnant
growth and rising inflation-are growing. Historically, such conditions have been highly favorable for gold prices, making its current lack of movement all the more perplexing.
Gold’s unexpected stalemate amid market uncertainty
Despite an economic backdrop that traditionally supports gold, the precious metal has struggled to gain traction. Investors
remain cautious, with speculation emerging that Trump could soon reach a tariff agreement with Mexico and Canada, temporarily easing market concerns.
During Thursday’s Asian session, gold fluctuated before pulling back significantly, as traders hesitated to take aggressive
positions ahead of Friday’s crucial US Nonfarm Payrolls report. This report is expected to provide deeper insights into the labor market’s health and influence potential Federal Reserve policy shifts.
While gold appears to be in a holding pattern, many market analysts believe that an eventual breakout remains likely. The ongoing
trade dispute, a weakening US dollar, the growing likelihood of Federal Reserve rate cuts, and mounting stagflationary pressures all continue to create a favorable environment for gold. Though its price action remains subdued for now, the fundamental outlook
suggests that the metal’s path of least resistance may still be to the upside.
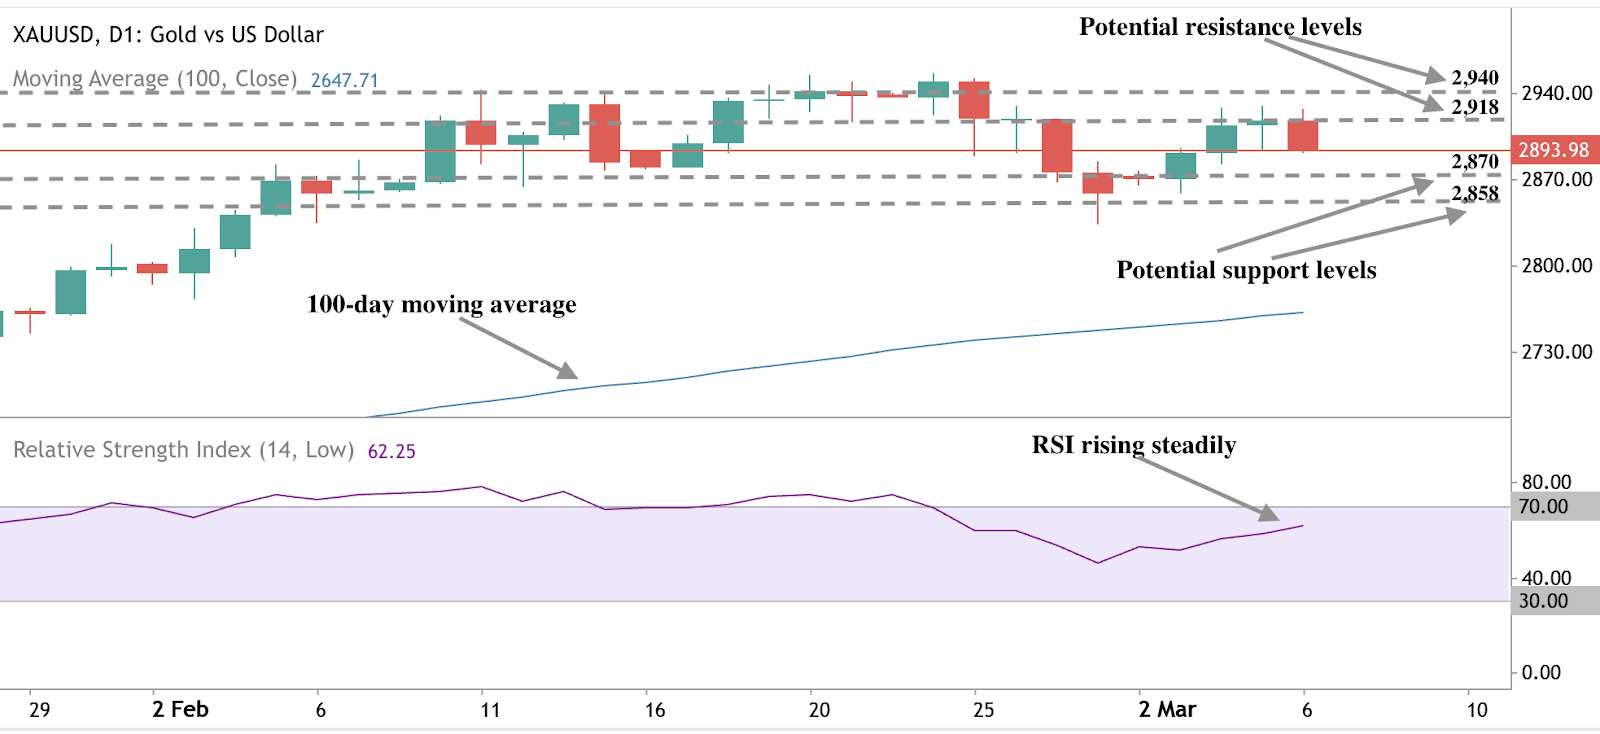
Technical analysis XAUUSD
At the time of writing, the yellow metal appears to be retreating from highs that threatened to touch the $3,000 mark. Bullish
sentiment and bias is clearly evident as prices remain above the moving average, with a backdrop of strong previous bullish candles. However, the current candle on the daily chart threatens to erase the gains of the past two days. RSI rising steadily towards
70 could also be a hint that we are soon approaching the overbought conditions.
Key levels to watch on the upside are $2,918 and $2,940. On the downside, the current pullback could find support floors
at the $2,870 and $2,858 price levels.
Source: Deriv MT5
Disclaimer:
The information contained within this article is for educational purposes only and is not intended as financial or investment advice. We recommend you do your own
research before making any trading decisions.
This information is considered accurate and correct at the date of publication. Changes in circumstances after the time of publication may impact the accuracy of the
information.
The performance figures quoted refer to the past, and past performance is not a guarantee of future performance or a reliable guide to future performance.