Reason to trust
Strict editorial policy that focuses on accuracy, relevance, and impartiality
Created by industry experts and meticulously reviewed
The highest standards in reporting and publishing
Strict editorial policy that focuses on accuracy, relevance, and impartiality
Morbi pretium leo et nisl aliquam mollis. Quisque arcu lorem, ultricies quis pellentesque nec, ullamcorper eu odio.
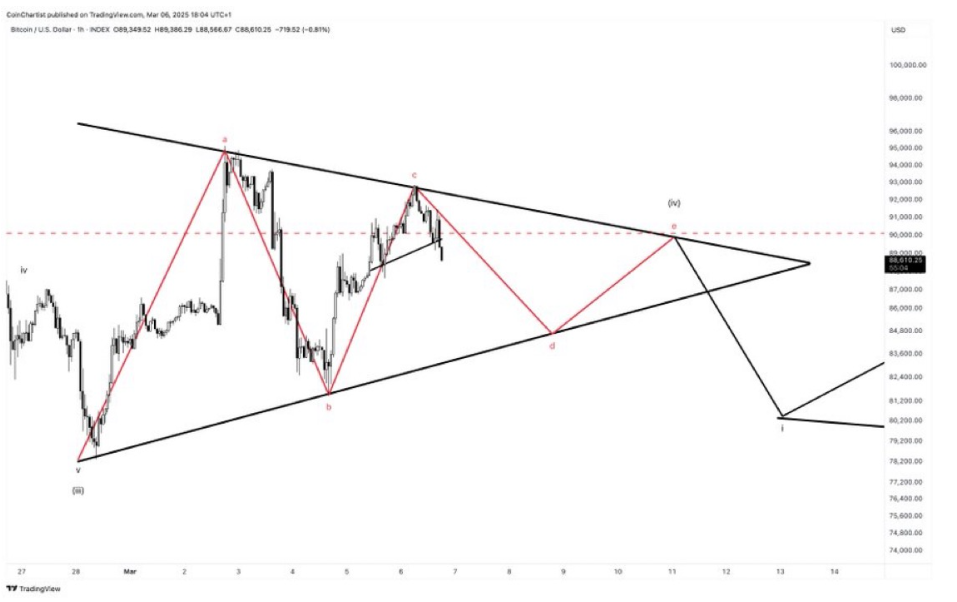
Tony Severino, a prominent crypto analyst, has shared a new Bitcoin price forecast, suggesting that the pioneer cryptocurrency is on the verge of another major correction. The analyst suggested that the formation of a Lower Time Frame (LTF) Head and Shoulders pattern on the Bitcoin price chart is a potential confirmation of a crash to mid-$80,000.
Bitcoin Price Projected To Crash To $83,600
The market’s recent downturn has negatively impacted Bitcoin’s value, prompting less-than-favorable predictions from top analysts. Severino posted on X (formerly Twitter) on March 6 that Bitcoin could soon experience another major pullback to new lows.
Related Reading
The analyst projected that Bitcoin could crash to $84,800 – $83,600. This bearish price outlook is supported by the recent formation of LTF Head and Shoulder pattern on the Bitcoin chart.
A Head and Shoulder pattern is a technical analysis formation that usually indicates a potential reversal from bullish to bearish. It appears as three peaks on a price chart, with the middle peak, which is the head, being higher than the others (the shoulders). Notably, the Head and Shoulder pattern is considered one of the most recognizable patterns for projecting a downtrend in a cryptocurrency.
In the case of Bitcoin, Severino’s chart illustrates a symmetrical triangle with an internal A-B-C-D-E wave-like structure. The black diagonal lines in the chart form the symmetrical triangle, which indicates lower highs and higher lows. Inside the triangle, red lines form the waves, suggesting that the Bitcoin price may be chopping sideways but with a bias towards completing the triangle.

Due to the Head and Shoulder pattern formation, Bitcoin could see its price break down to the lower boundary of the triangle around the mid $80,000 region. This price crash would complete the D wave and possibly test the next critical support area.
Once Bitcoin drops to this level, Severino predicts that it could bounce back to new highs. The chart shows that Bitcoin could rally toward the E wave in the triangle, which is positioned around the $90,000 price level.
Furthermore, the analyst’s Bitcoin chart indicates another deeper pullback after this price rebound to $90,000. Toward the right side of the chart, an arrow points downwards, suggesting that after the final E wave rally, Bitcoin could drop down towards $83,600 to $80,200.
Analyst Warns Of Bear Trap Before Bull Run Finale
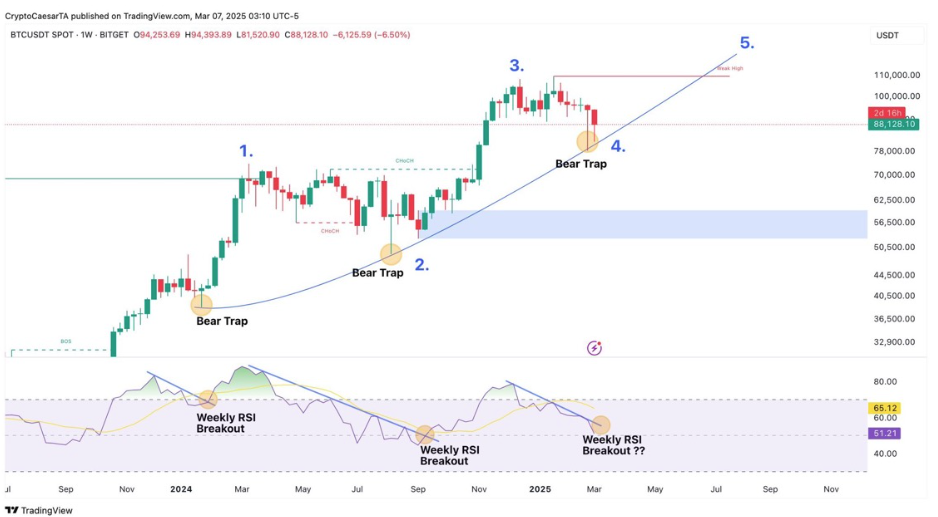
While many in the crypto market label this massive decline in the Bitcoin price as the beginning of the bear market, others believe that this price crash could be a mere bear trap. A market expert known as ’Crypto Caesar’ predicted that Bitcoin would be on the verge of its final bear trap before entering the last phase of this bull cycle.
Related Reading
This implies that Bitcoin is likely to face another sharp decline, shaking out weak hands before surging to a new all-time high. The analyst’s chart predicts that it could top out above $110,000, signaling the end of the bull market.

Featured image from Pexels, chart from TradingView

