


Bitcoin price has traded mostly flat over the past 24 hours near $68,000, reflecting continued indecision. The broader seven-day trend still shows a mild decline, highlighting the lack of strong bullish momentum. Yet one prediction market’s positioning is telling a far more optimistic story.
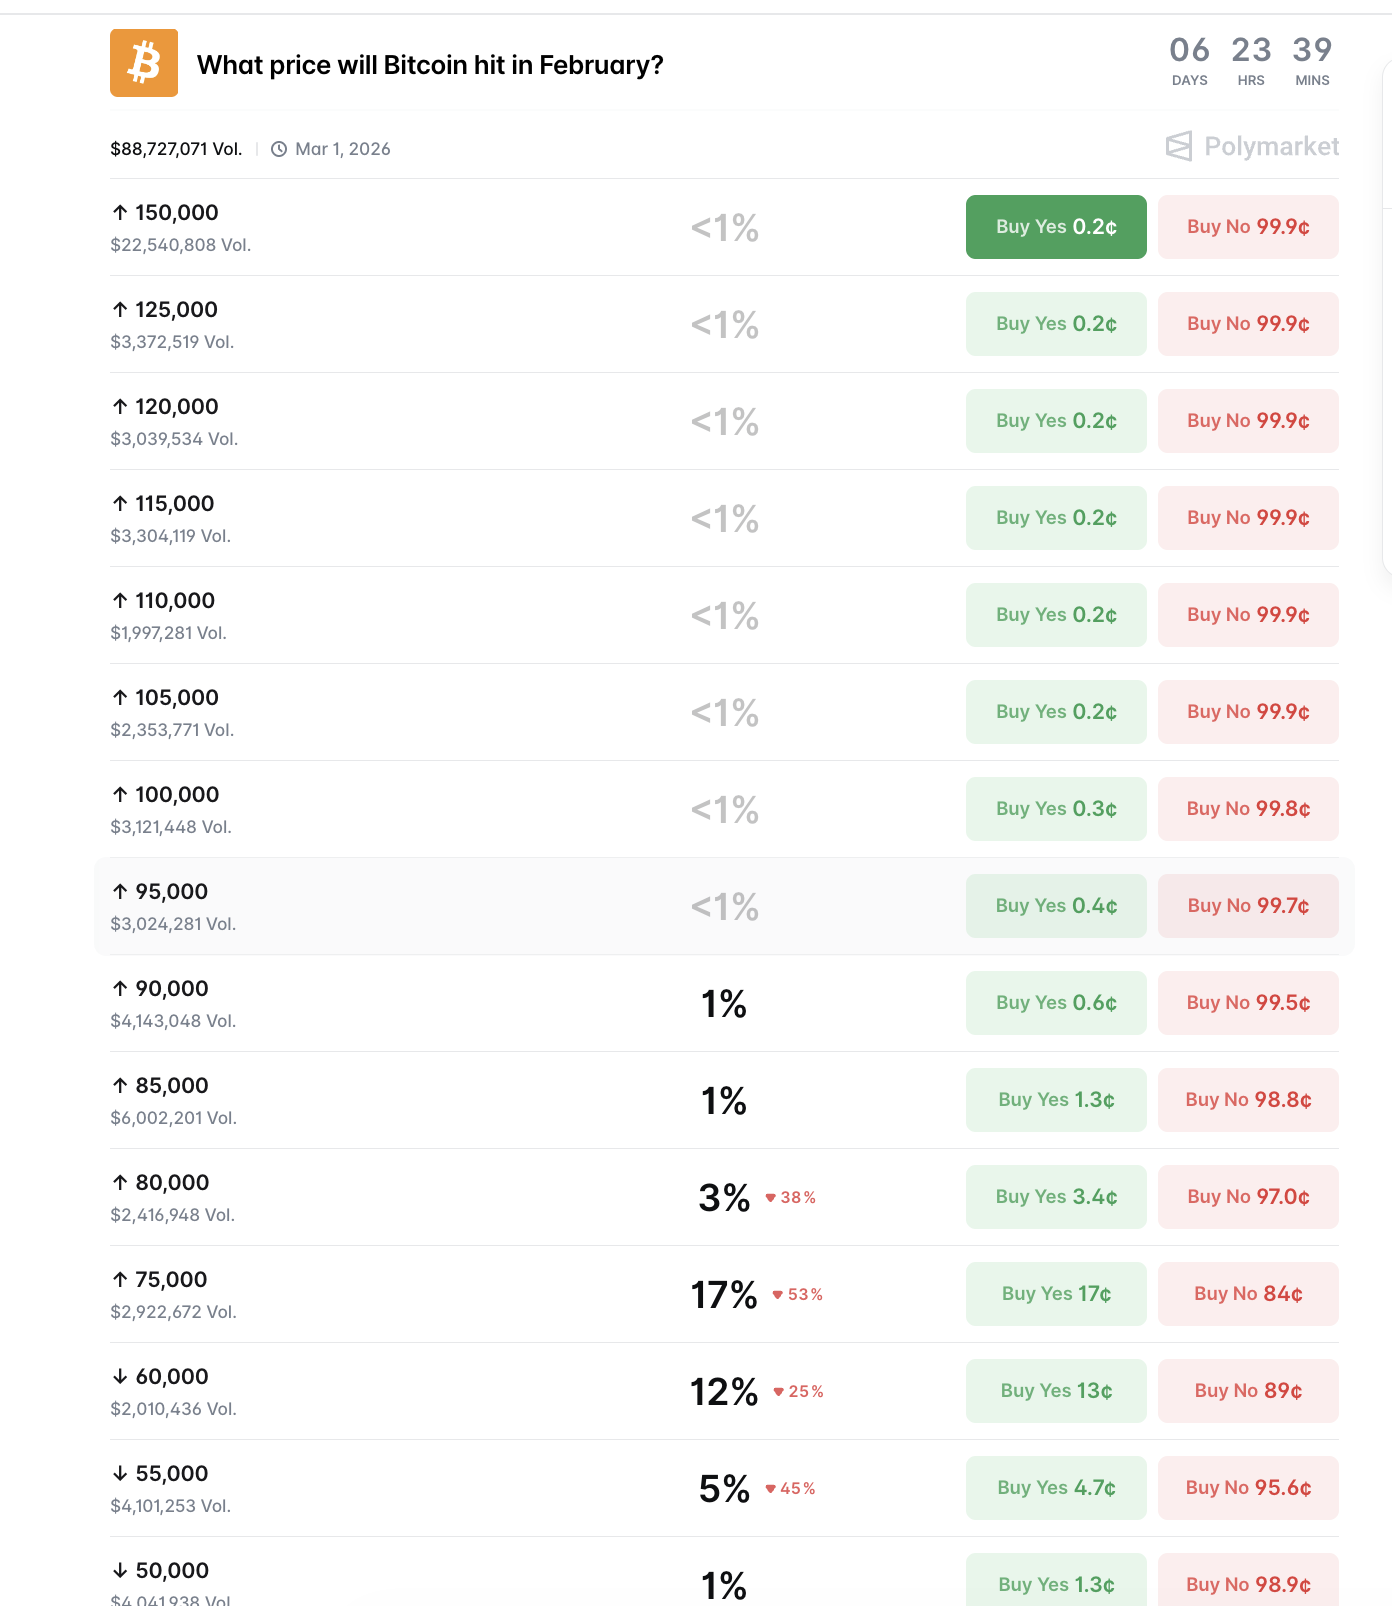
On Polymarket, the single largest February outcome, at 17%, expects Bitcoin to cross $75,000. This makes it the most popular directional bet as the month approaches its final week. However, market structure, on-chain activity, and whale positioning suggest reality may not align with this bullish expectation.
Prediction Markets Favor $75,000 — But Hidden Bearish Divergence Signals Trouble
Prediction market data shows ‘above $75,000’ remains the most favored February target despite weakening sentiment. Polymarket volumes, for this bet, exceed $88 million, with millions in active liquidity.
However, the probability of the $75,000 outcome has already declined by more than 50%, reflecting fading confidence.
At the same time, the next most likely outcome sits at ‘under $60,000’ with a 12% probability. This positioning reveals a growing split in expectations. While many traders still hope for upside, a large portion of the market is increasingly preparing for a deeper correction instead.

This growing caution aligns closely with Bitcoin’s technical structure.
On the daily chart, Bitcoin formed a lower high between November 15 and February 16. This means price failed to fully recover during its latest rally attempt.
Meanwhile, the Relative Strength Index (RSI), which measures momentum strength, formed a higher high during the same period.
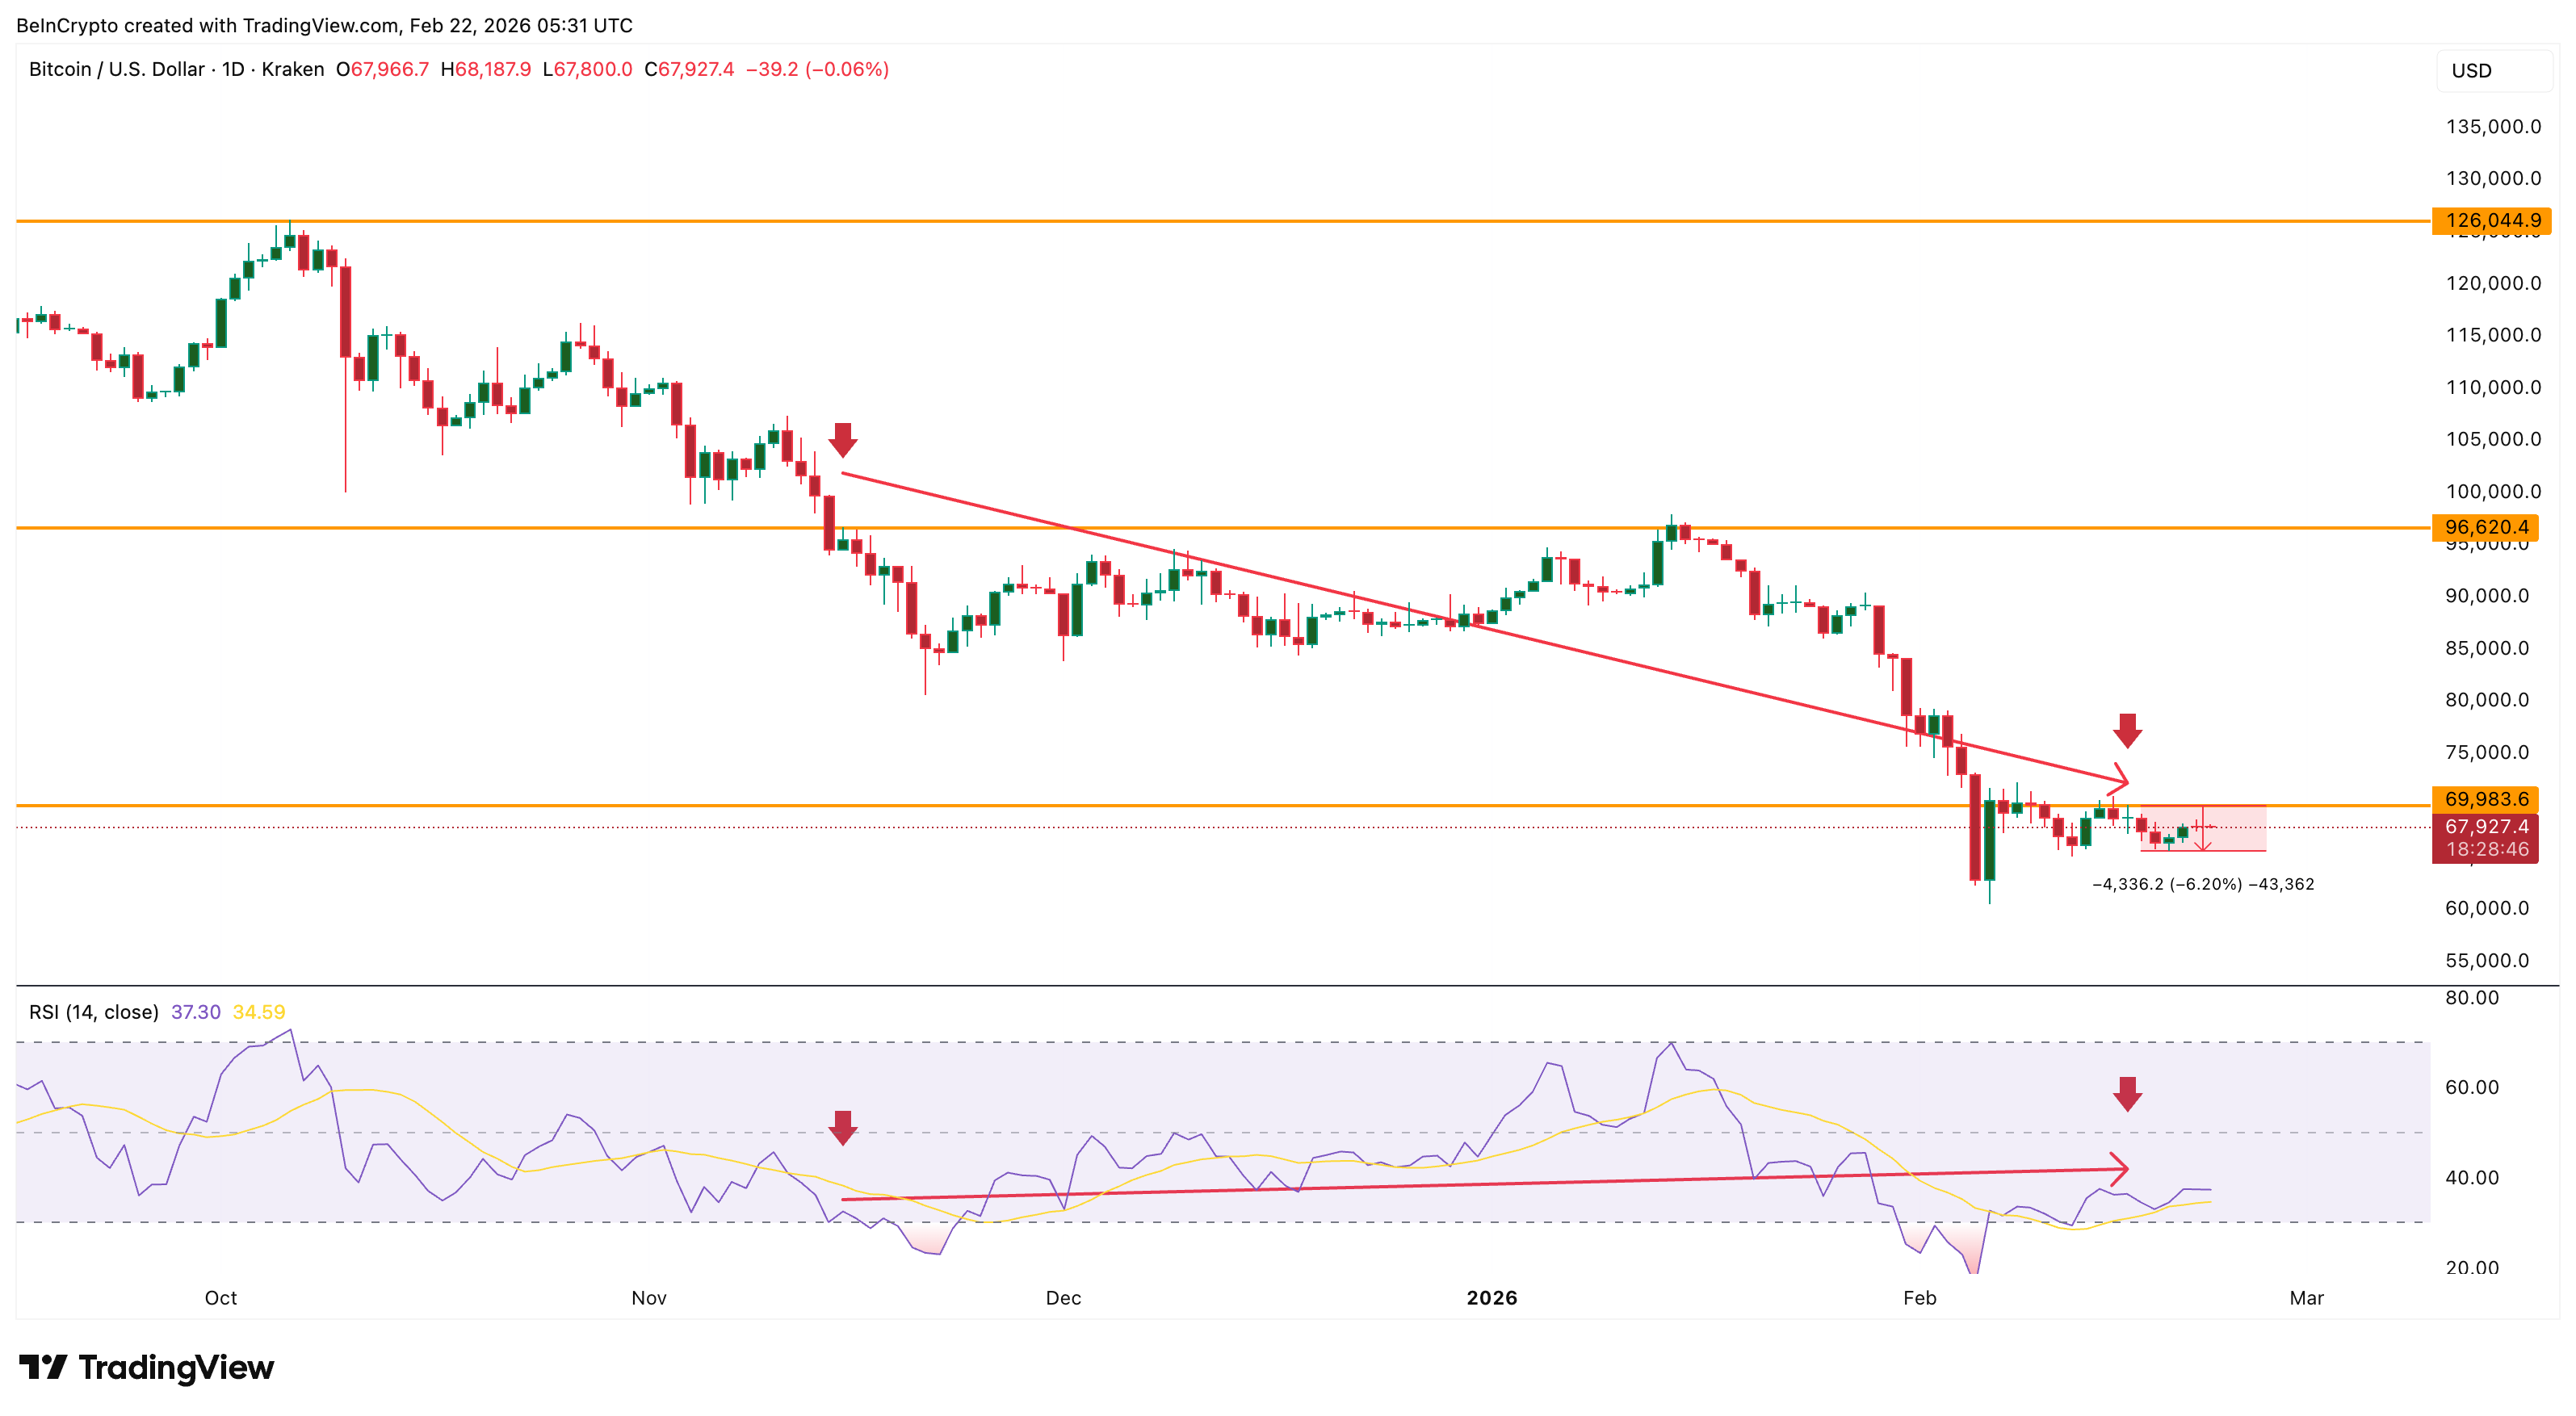
Because Bitcoin was already in a downtrend, this creates a hidden bearish divergence. This pattern usually signals continuation of the existing downtrend rather than a bullish reversal. It shows that even though momentum improved briefly, the broader selling pressure remains intact.
Since this divergence appeared, Bitcoin has already corrected nearly 6%. As long as this signal remains active, the probability of reaching the prediction market’s $75,000 target remains limited.
Long-Term Holders Have Slowed Selling, But Have Not Started Buying
Long-term holder activity helps explain why prediction markets still retain some optimism, even as risks increase. These investors may have held Bitcoin for more than 1 year. Their buying and selling patterns often determine whether Bitcoin enters a sustained rally or correction.
On February 5, long-term holders reduced their holdings by 244,919 BTC (30-day rolling change), a sign of extremely heavy selling. By February 21, this number improved to 81,019 BTC. This marks a roughly 67% reduction in selling pressure.
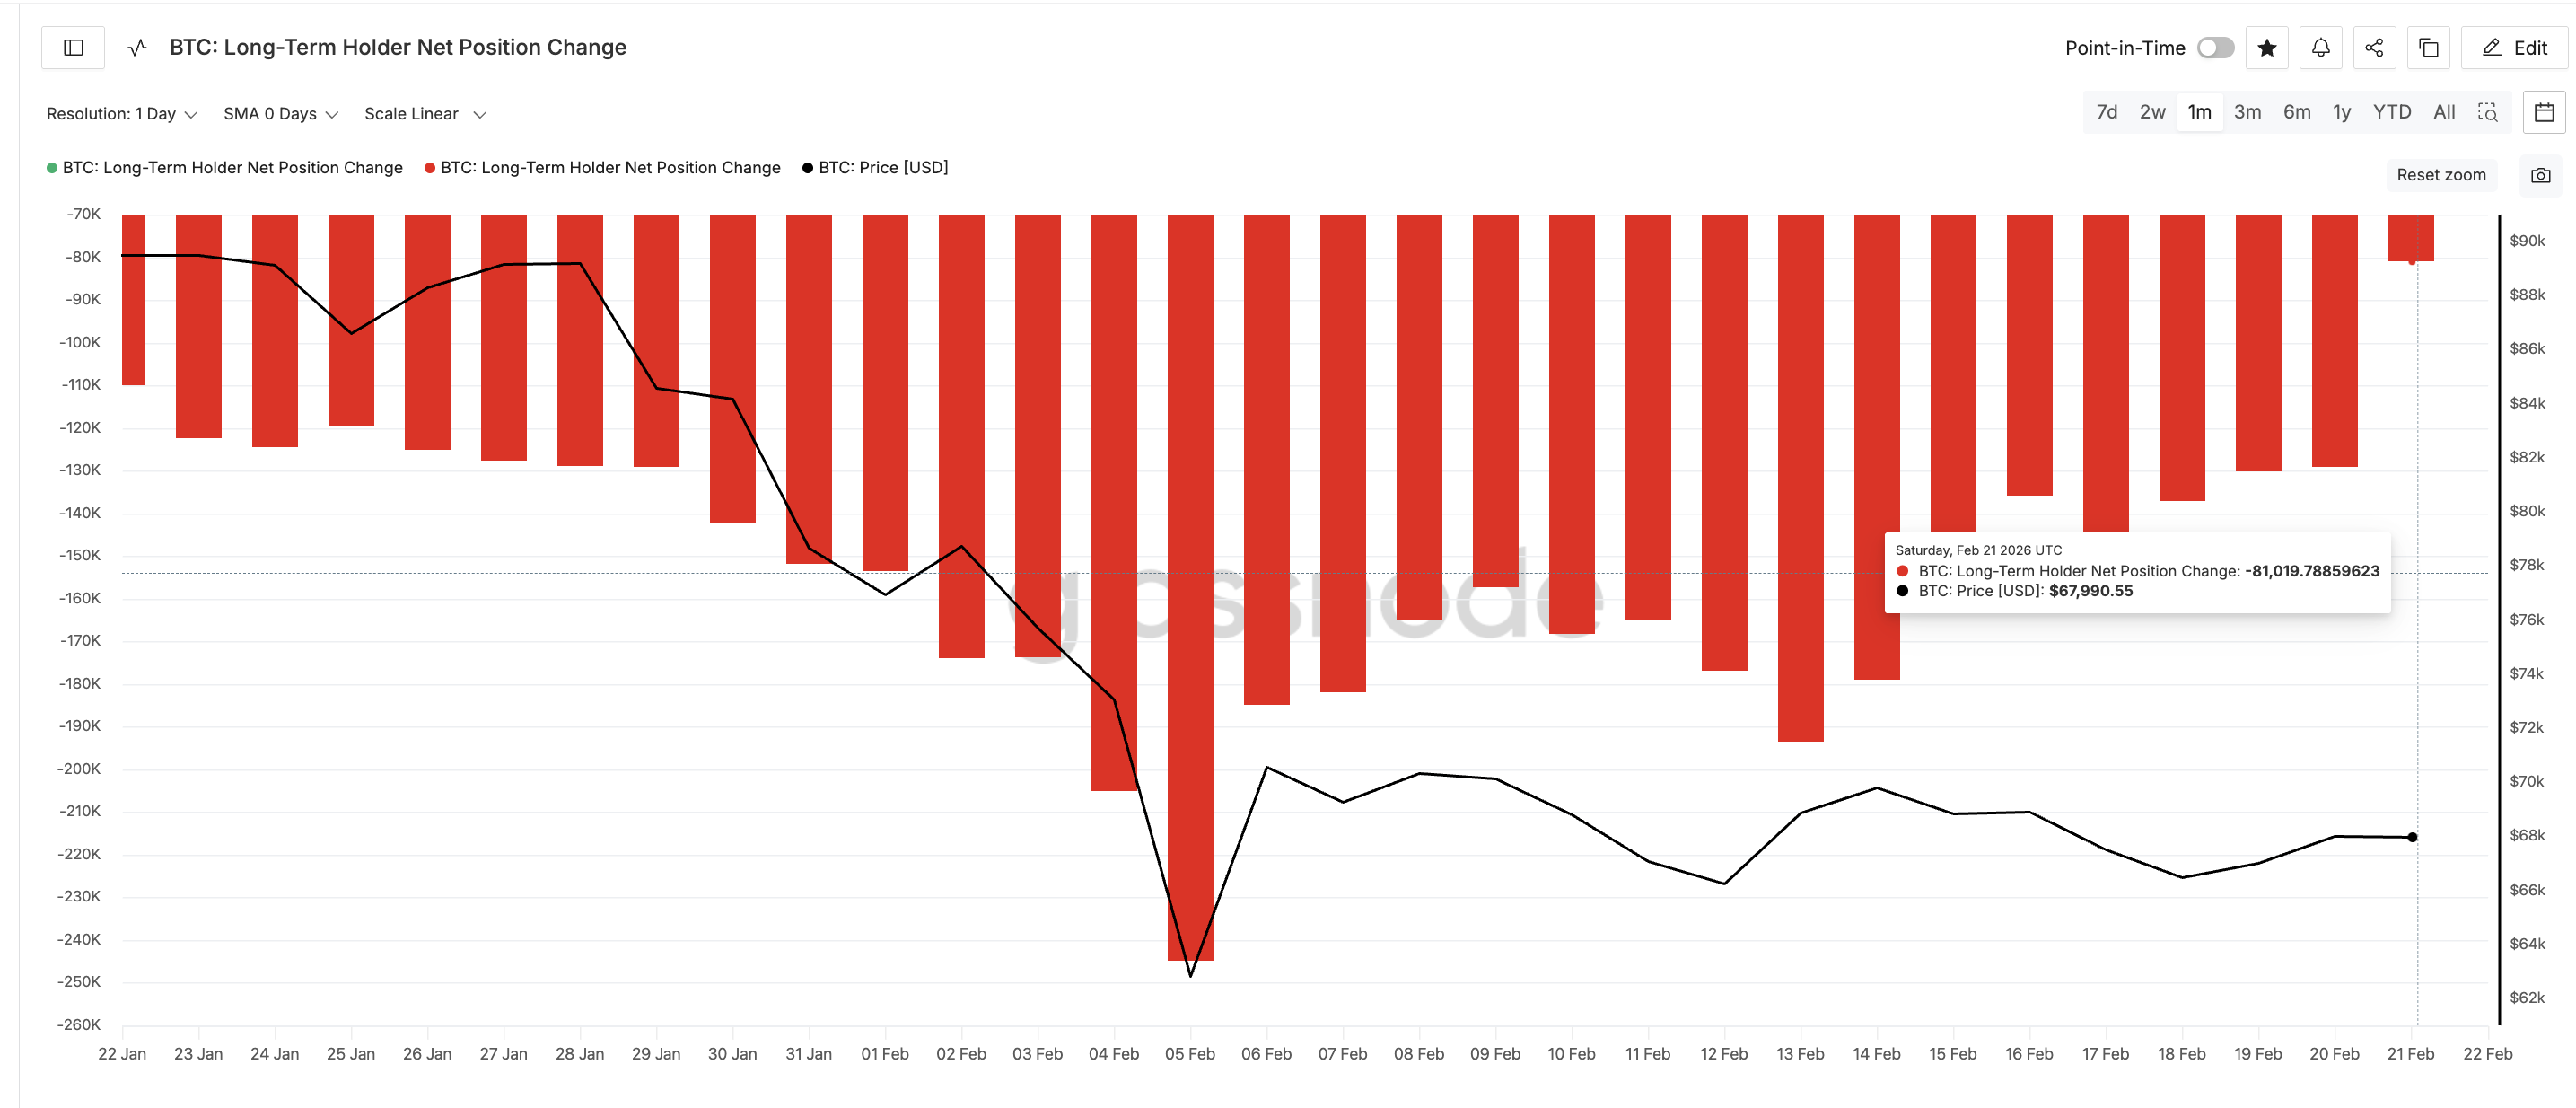
This sharp slowdown in selling helps stabilize Bitcoin’s price and explains why some traders still expect upside.
However, long-term holders are still net sellers overall. They have not yet transitioned into accumulation. Their activity has improved, but they are not yet providing the strong buying support needed to push Bitcoin toward new highs.
This creates a neutral balance. Bitcoin may avoid immediate collapse, but it also lacks the strength needed for a major breakout to push it close to $75,000.
Whale Behavior Is Split
Whale positioning further reflects uncertainty.
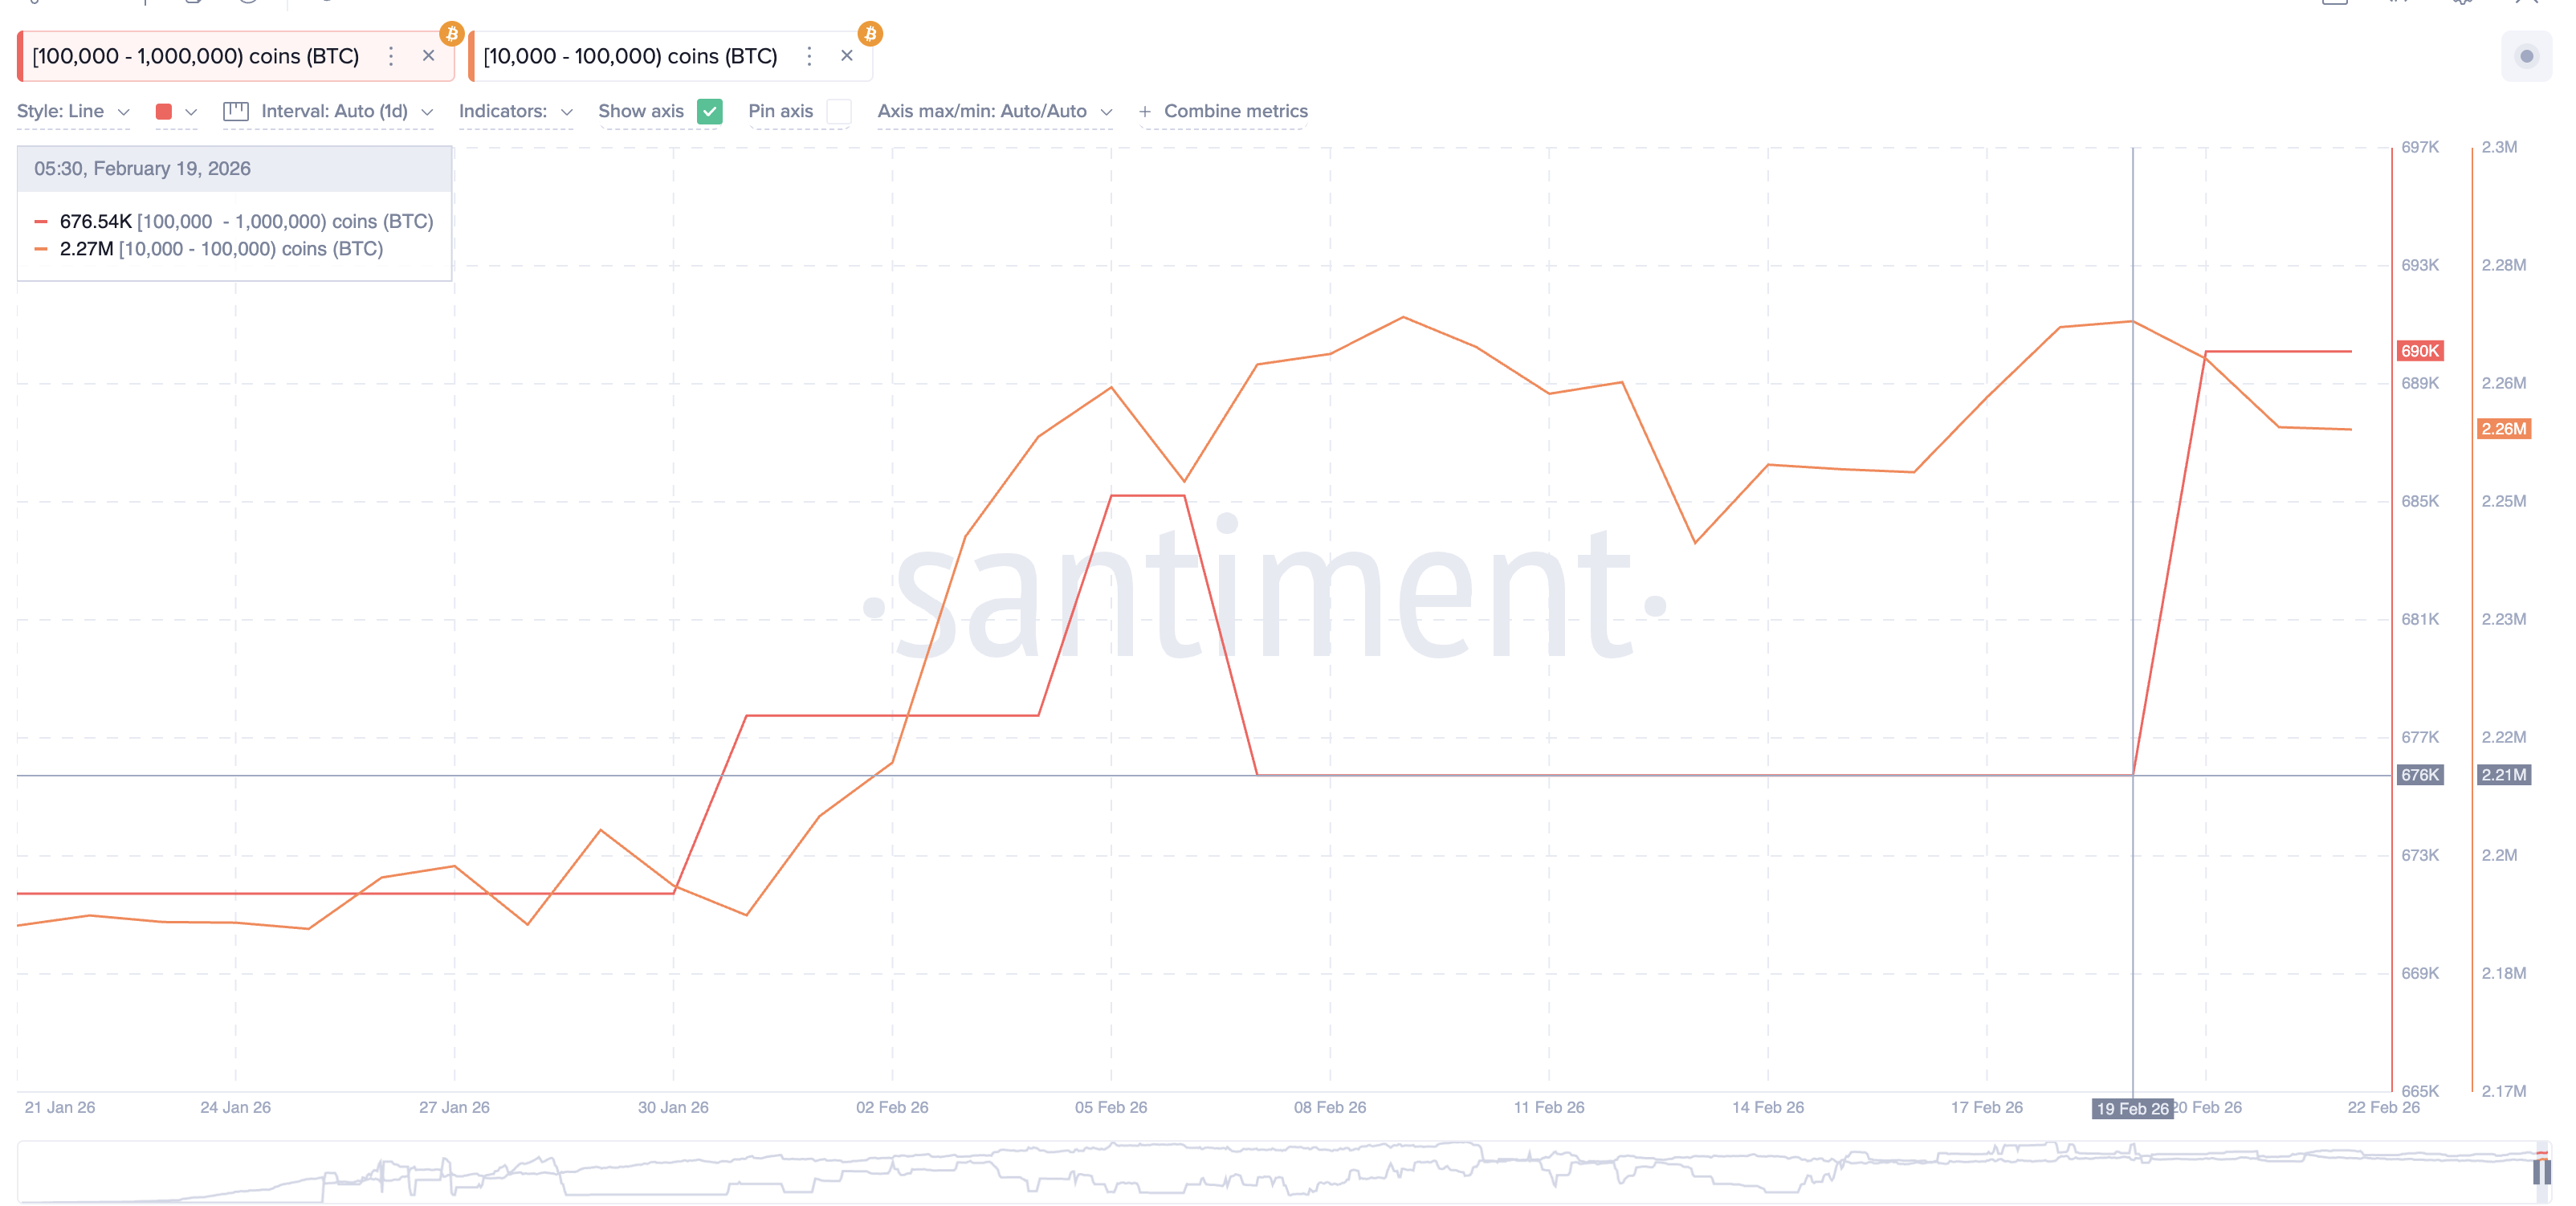
The largest Bitcoin whales, holding between 100,000 and 1 million BTC, increased their holdings from 676,540 BTC to 690,000 BTC. This represents an accumulation of about 13,460 BTC, signaling cautious buying.
However, smaller whales holding between 10,000 and 100,000 BTC reduced their holdings from 2.27 million BTC to 2.26 million BTC. This means roughly 10,000 BTC were sold during the same period.
This opposing behavior shows a lack of unified conviction, even though the net balance slightly tilts towards accumulation. Some whales are preparing for a rebound, while others remain defensive.
At the same time, cost basis distribution data reveals a major resistance cluster between $72,600 and $73,200. Around 149,000 BTC were accumulated in this range. These levels also appear clearly on the price chart as a major resistance zone just below $75,000.
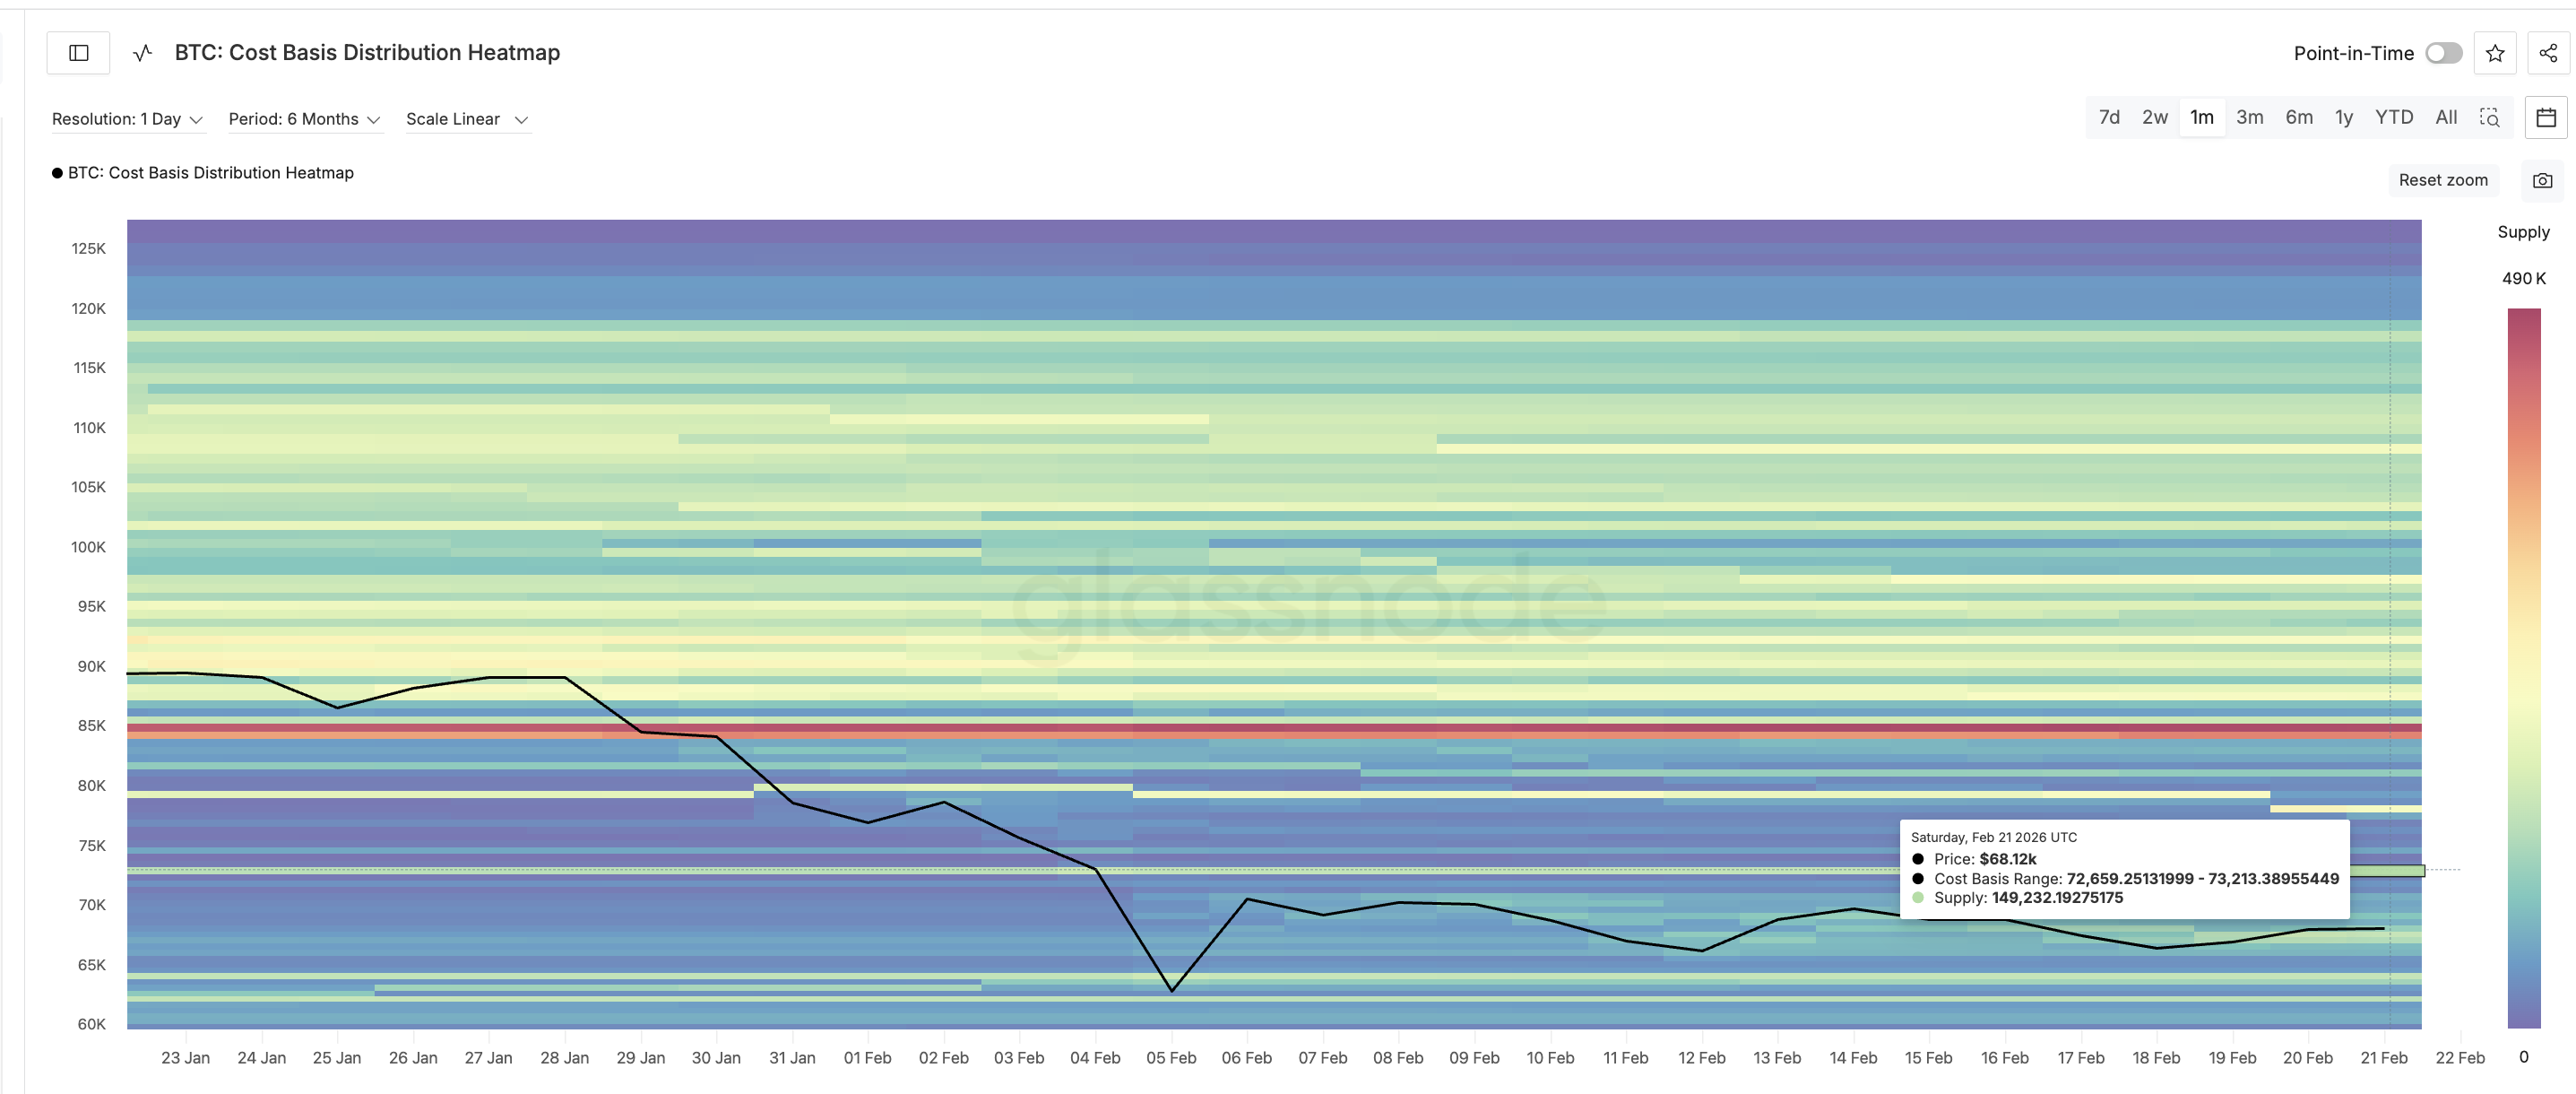
When Bitcoin approaches this area, many holders may sell to exit at breakeven. And the whale accumulation strength, as seen, isn’t strong enough to absorb the supply yet. This selling pressure creates a strong barrier that prediction markets may be underestimating.
Bitcoin Price Structure Shows BTC May Remain Trapped Between Key Levels
Bitcoin’s price structure closely aligns with these on-chain cost basis clusters.
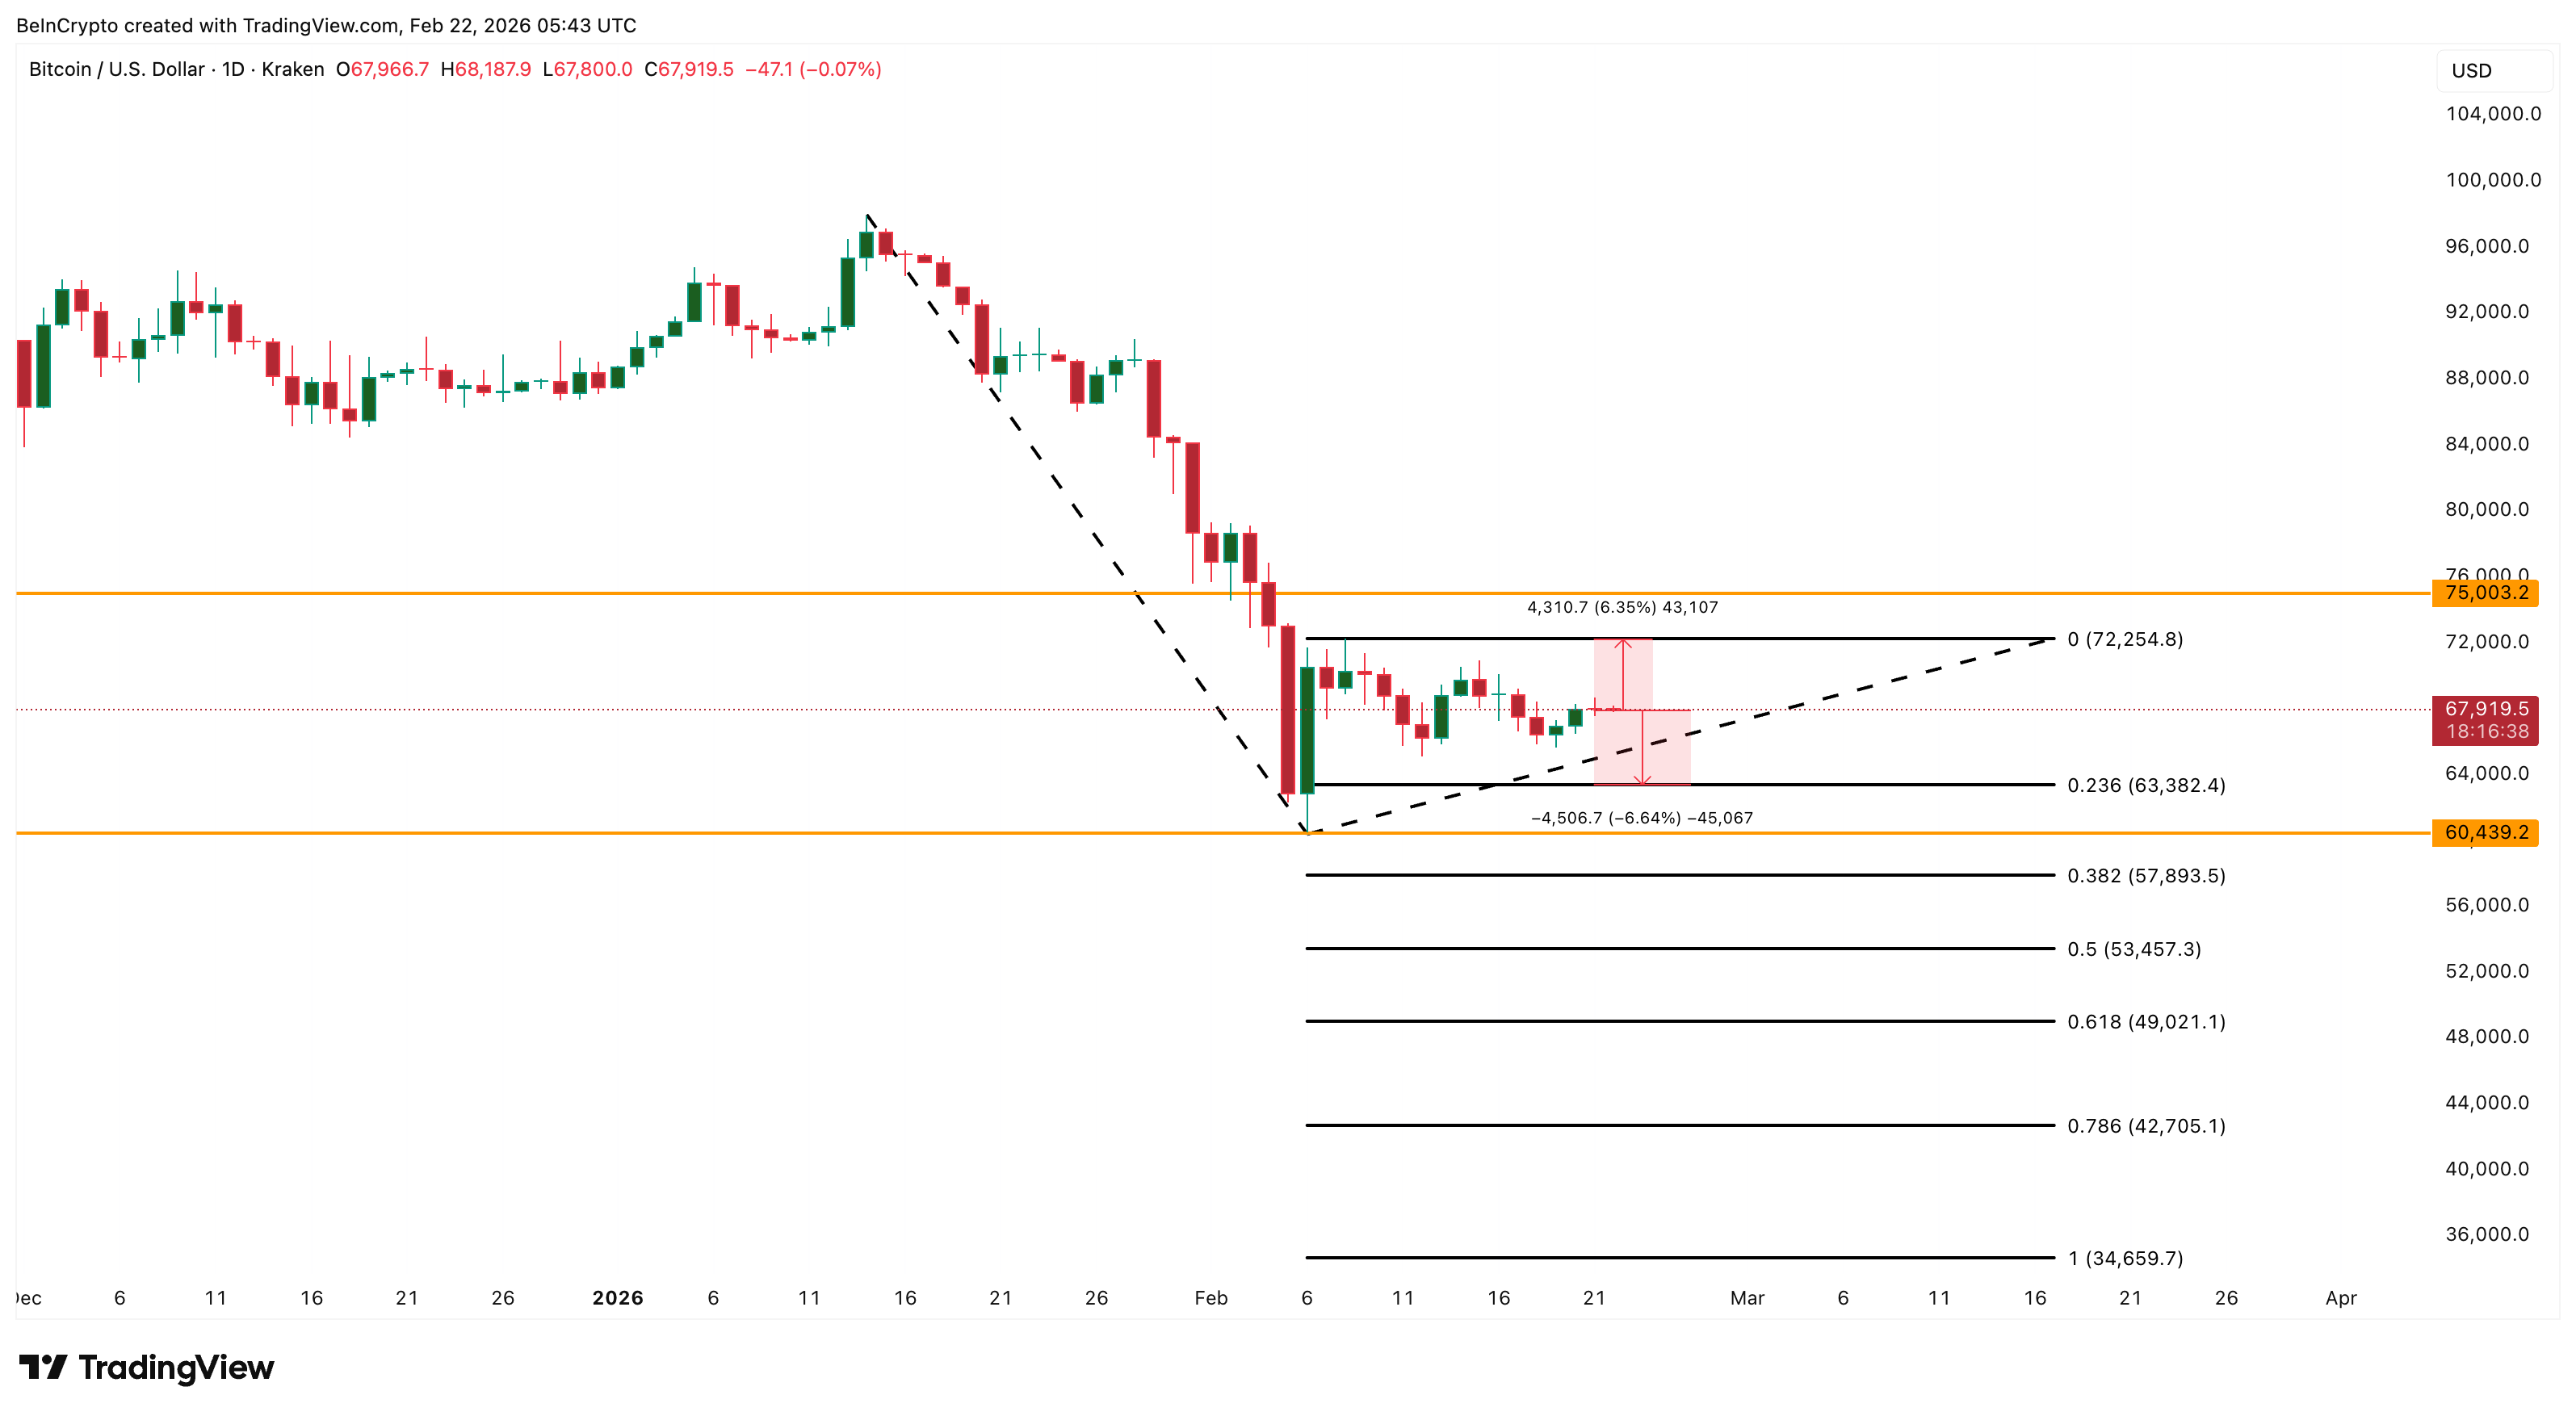
To reach the $75,000 prediction target, Bitcoin must first break above $72,200. This level represents both technical resistance and is close to one of the largest cost basis clusters on the chart. Breaking this zone would require a rally of more than 6% from current levels.
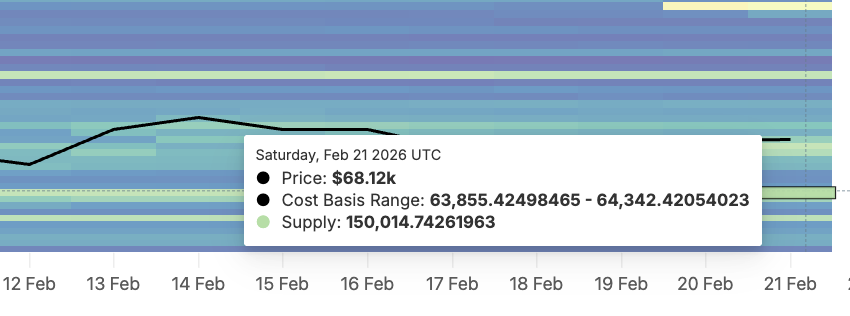
However, failure to break this resistance increases the likelihood of continued range-bound movement. On the downside, strong support exists between $64,300 and $63,800, where approximately 150,000 BTC were accumulated.
On the Bitcoin price chart, the key support level resembling the zone is $63,300, breaking which would also mean the supply cluster break. Breaking under $63,300 can make the $60,000 zone, the 12% probability bet on Polymarket, come to fruition.
As a result, Bitcoin is currently trapped between two major cost basis zones. Resistance near $72,200 limits upside, while support near $63,300 prevents immediate collapse.
This range-bound structure suggests that prediction markets may be overestimating the probability of a breakout toward $75,000 while underestimating the growing risk of continued consolidation or a correction.


