
The cryptocurrency market extended its slide on Thursday, with Bitcoin price briefly falling under $110,000 before regaining some ground.
CoinGecko data showed that the Bitcoin price dropped to $107,500 from $110,400, representing a decline of 3% in the past 24 hours.
Most major altcoins followed the same path. Nine of the top ten non-stablecoin assets traded lower, losing between -0.9% to -5.3%.
The drop came after a surge in Bitcoin transfers from miners to exchanges, hinting at mounting selling pressure.
Just a few weeks earlier, miners were adding to their Bitcoin holdings despite higher costs and tighter margins. That trend reversed as falling transaction fees cut into revenue, worsened by April’s halving and higher network difficulty.
Will Q4 2025 Bring Another Wave of Volatility for Bitcoin Traders?
The Bitcoin price extended its weekly decline, trading near $107,500 after falling approximately 10.8% over the past seven days.
Similar sell-offs have marked late stages of previous market cycles, often reflecting caution among investors.
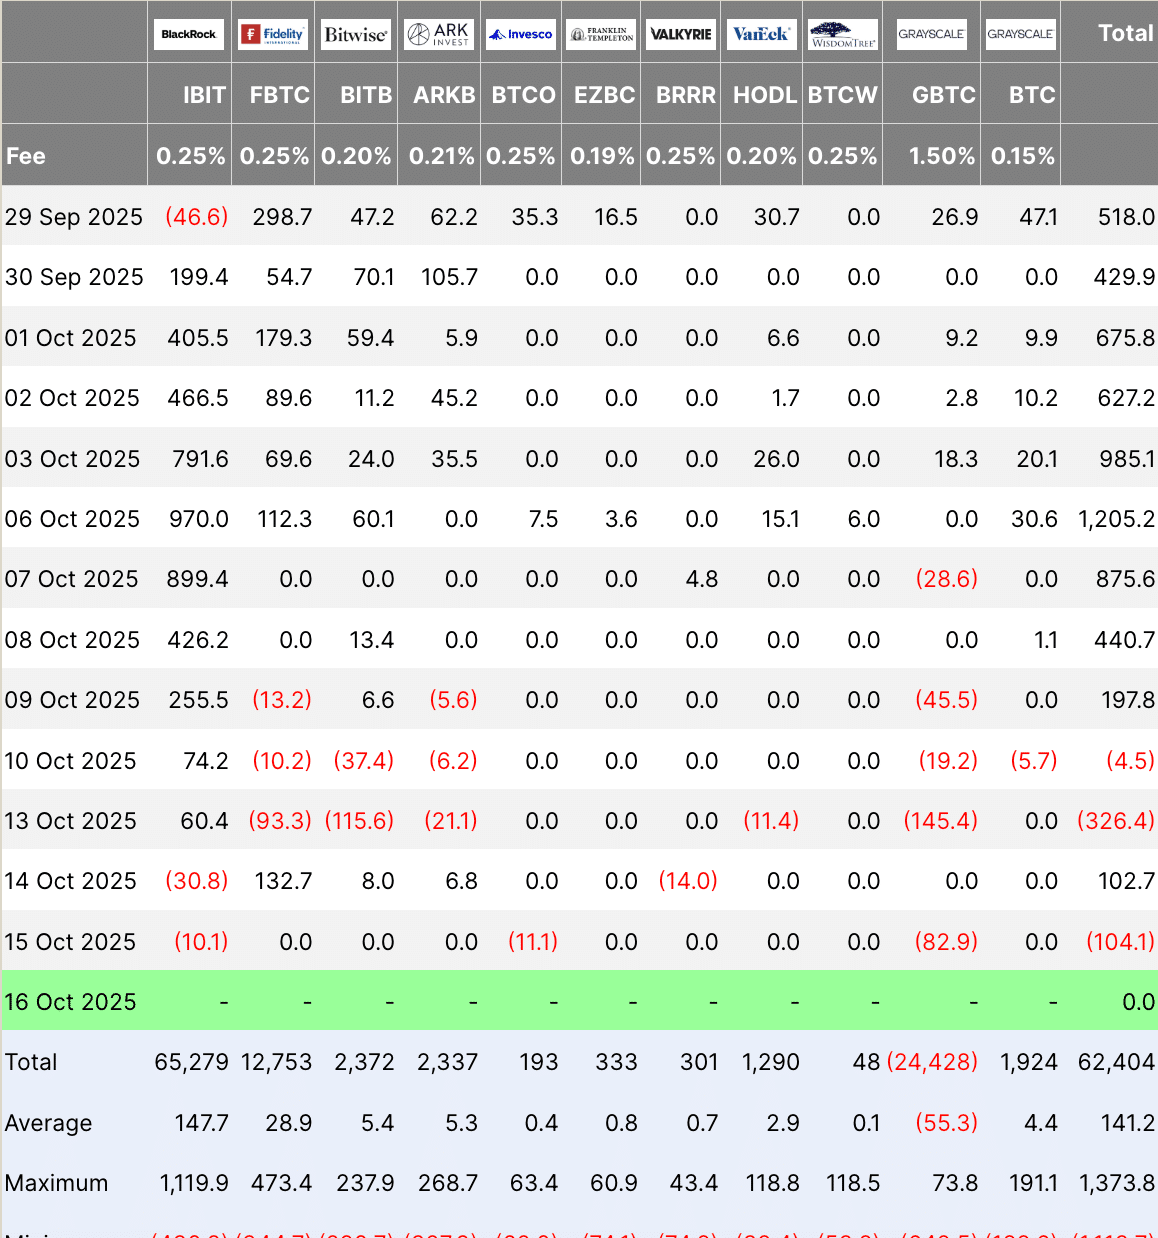
Data from Farside shows that Bitcoin exchange-traded funds have seen outflows of more than $108M since the start of the week, adding to the market’s selling pressure.
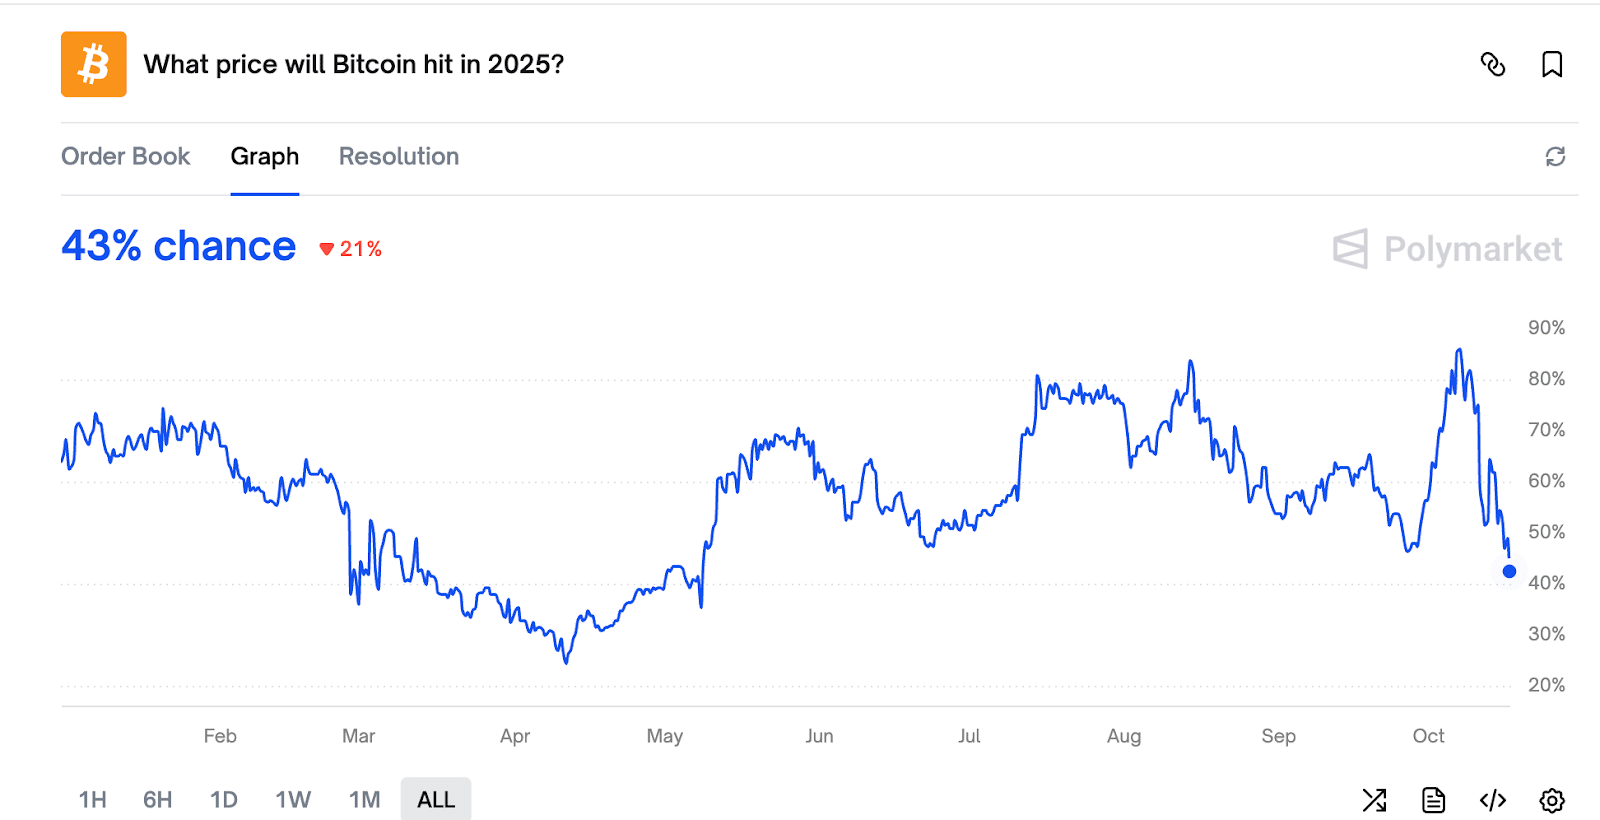
According to Derbit data, options traders have placed over $1.7Bn in bets that the Bitcoin price will rise above $130,000 before year-end.
Polymarket data suggests that participants assign better than a 50% chance to that scenario in 2025.
Analysts at CryptoQuant called the recent $19Bn drawdown a “leverage flush,” suggesting it’s a market reset rather than the start of a long decline.
During Friday’s crash, spot volume hit $44B (near cycle highs), futures $128B, while OI dropped $14B with only $1B in BTC long liquidations. 93% of OI decline wasn’t forced – this was a controlled deleveraging, not a cascade.
A very mature moment for Bitcoin. pic.twitter.com/sTrziRUXXo
— Axel
Adler Jr (@AxelAdlerJr) October 14, 2025

Technically, Bitcoin’s weekly chart shows the price slipping below the bull market support band a zone defined by the 20-week SMA and 21-week EMA.
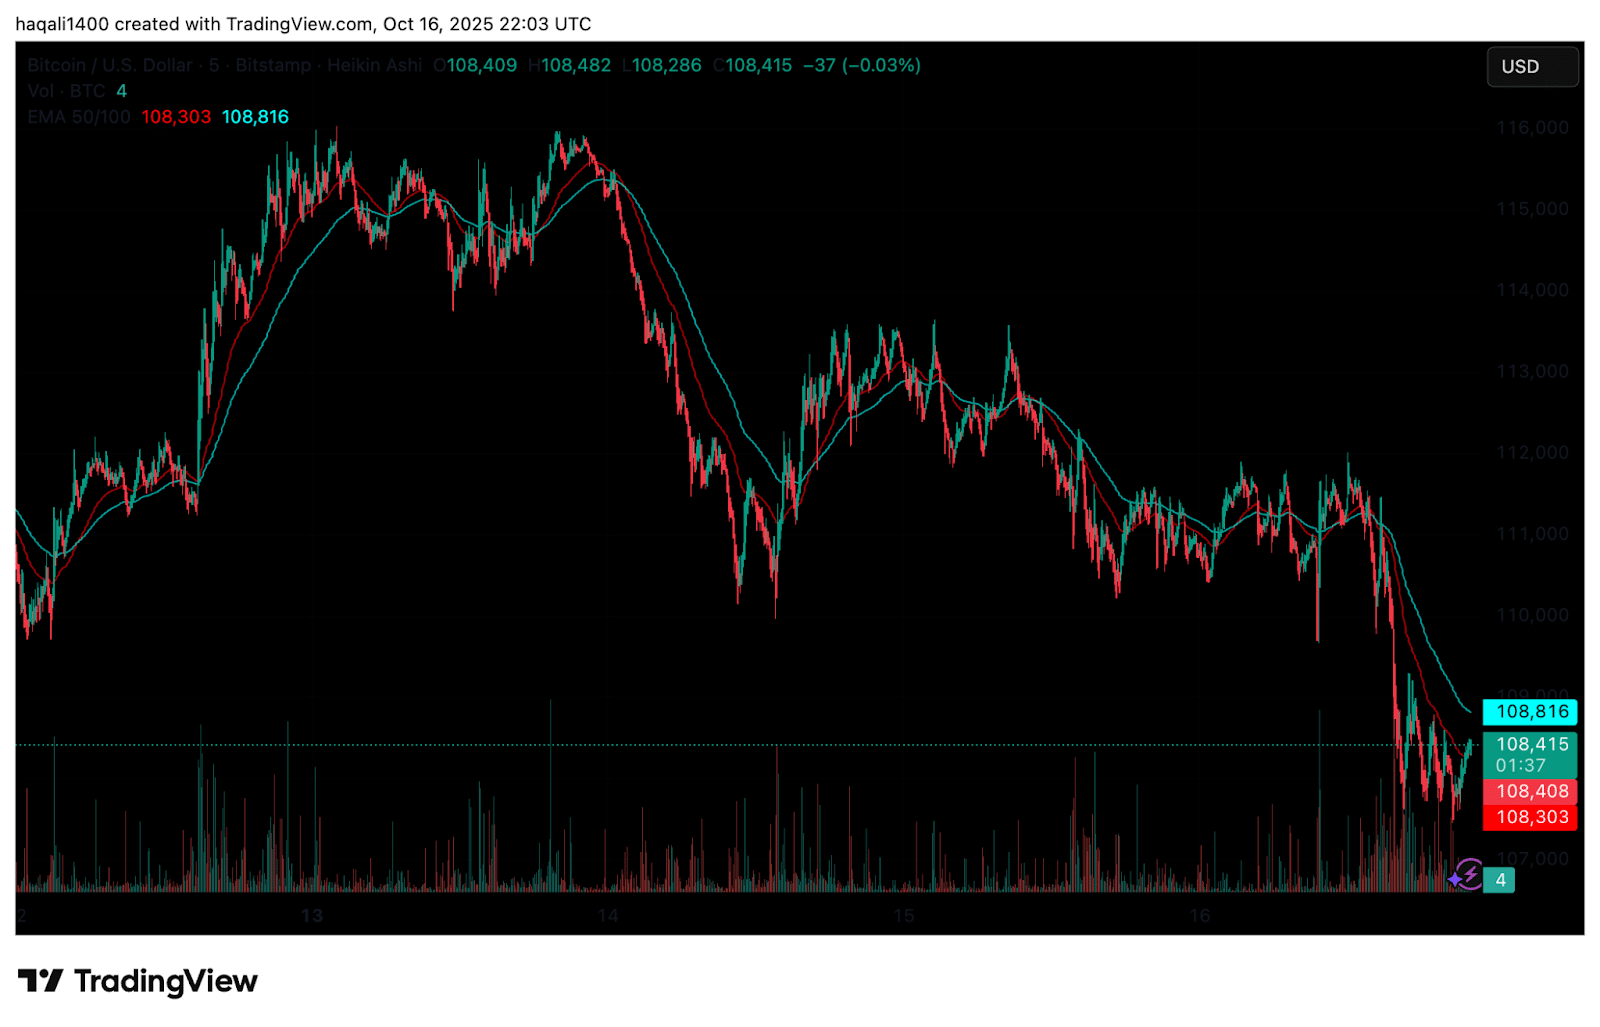
(Source: BTC USD, TradingView)
The level has historically acted as a strong pivot in past cycles. Now hovering near $108,000, Bitcoin faces a key test.
A close below this range could turn short-term sentiment bearish, opening the door to the $100,000-$102,000 support zone.
DISCOVER: Best New Cryptocurrencies to Invest in 2025
Bitcoin Price Prediction: Is the 2025 “Trump Tariff Crash” Repeating Bitcoin’s 2020 Pattern?
Analyst Daan Crypto said broader conditions still look supportive. With stocks and gold near record highs, strong liquidity may help the Bitcoin price maintain stability around current levels.
$BTC Has been battling around its bull market support band but is losing it again. It's important to stick around this area on the higher timeframes and weekly closes.
As long as stocks & gold remain near their all time highs, I think BTC has a good chance to hold this area.… pic.twitter.com/5C5u2c7Q3x
— Daan Crypto Trades (@DaanCrypto) October 16, 2025
Historically, late-year trading often brings sharp swings. The market could experience another burst of volatility heading into the final quarter of 2025, before a clearer trend emerges.
Analyst TedPillows shared a chart comparing Bitcoin’s 2020 “Covid Crash” with the recent “Trump’s China Tariff Crash.”
$BTC has been consolidating after last week's crash.
Sentiment is at an all-time low, people are panic selling and "it's all over" is on the timeline.
This doesn't happen at the top, but rather at the bottom. pic.twitter.com/6SQ4F7yPj5
— Ted (@TedPillows) October 16, 2025
The two trends show similar behavior. In 2020, Bitcoin’s steep drop was followed by a fast rebound and a long rally to new highs. The 2025 chart is tracing the same pattern: a deep sell-off, then a base forming near the lows.
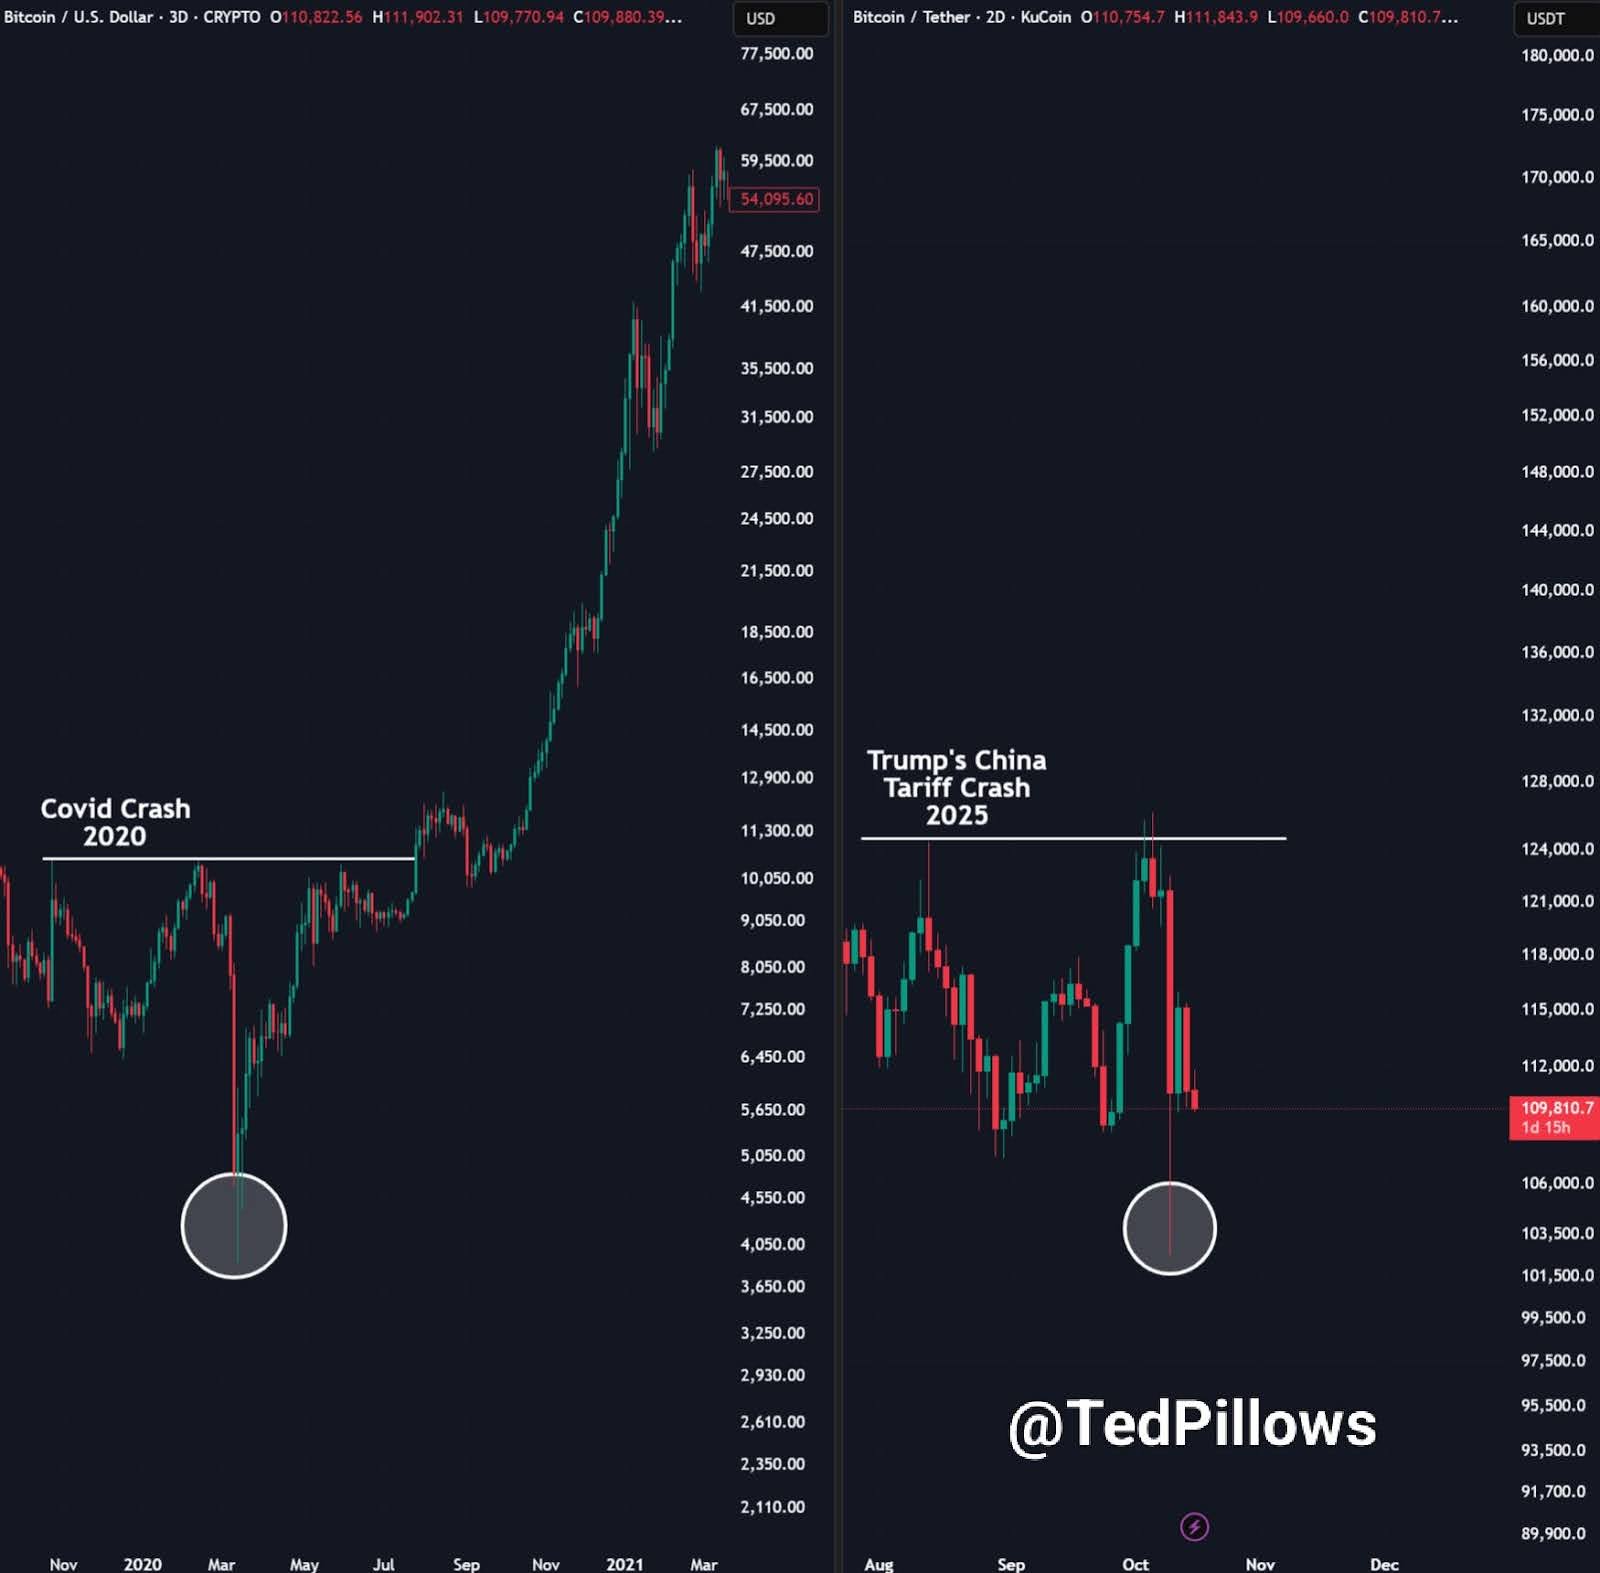
The existing candles are indicative of capitulation. The long wicks recorded and the heavy sell volume are indications that panic selling may be nearing its end, and this is typically a sign of the bottom.
At the time of his analysis, the Bitcoin price traded at nearly $110,000, which may form a double-bottom pattern, similar to that of March 2020.
The symmetry of the chart suggests that market fear can be at its peak, and this can be the start of a recovery as soon as the selling pressure subsides.
According to Glassnode data, the small Bitcoin holders continue to accumulate their holdings.
The charts show that the accumulation of wallets containing 1 to 1,000 BTC has been increasing since the end of September.
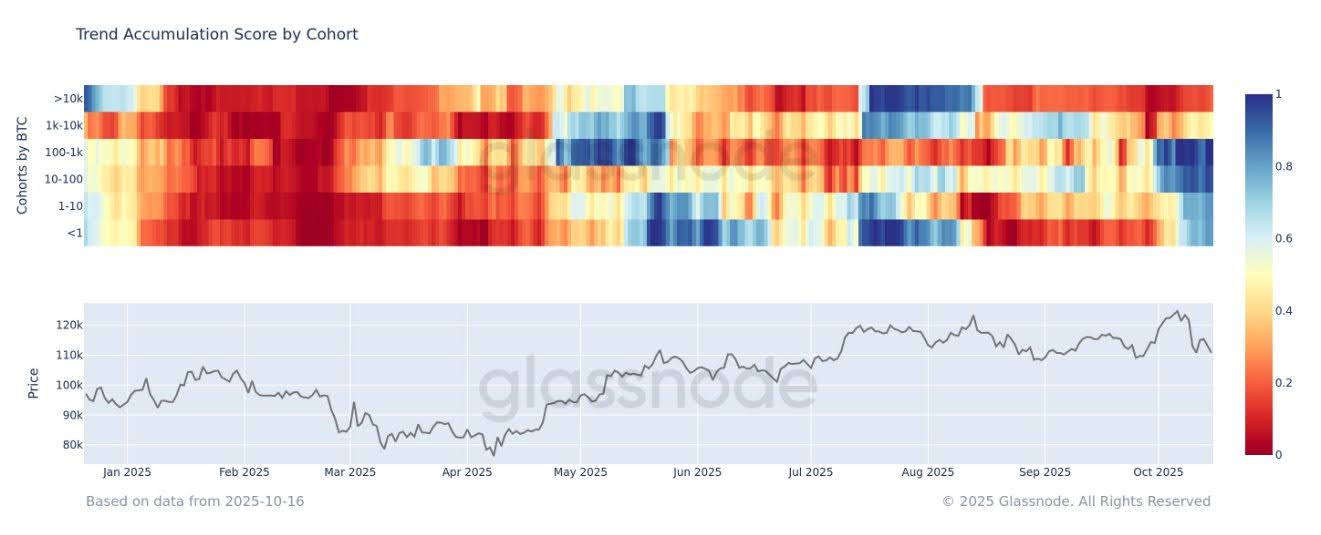
In the meantime, large holders who own over 10,000 BTC have either reduced their purchases or slightly decreased their holdings, indicating that central accumulation has ceased.
This move indicates a newfound confidence of the retail and mid-size investors as Bitcoin trades at $110,000-$115,000.
Historically, it has been commonly observed that this type of accumulation by smaller holders precedes recoveries that occur in the wake of widespread market corrections.
DISCOVER: Best New Cryptocurrencies to Invest in 2025
The post Will Bitcoin Recover After $5.6Bn Miner Sell-Off? Analysts Weigh In on $110K Support and 2020-Style Bottom appeared first on 99Bitcoins.